SI Integration in the Energy Industry
Assess the real value of SI in energy through current data, implementation examples, data architecture and a measurable transformation roadmap.



SI integration in the energy industry means connecting SI models to existing systems and business processes so that generation, consumption, maintenance and grid data turn into better decisions. Its value depends on the accuracy of the prediction it produces, and equally on how that prediction is used in the field, which cost it reduces and how it affects operational reliability.
As of 2026, energy companies face two agendas that influence each other. SI offers new ways to run energy systems more efficiently. At the same time, the growth of data centres is creating new demand on electricity supply and grid connections. That is why the energy transition and SI strategy need to be planned together.
At Webtures, we treat this transformation as an implementation problem that starts with data and ends in a measurable business outcome. Before deciding which model to use, the process to be improved, the owner of the decision, the data required and the acceptable error margin should be defined. An approach built this way clarifies the organisation’s investment priorities and makes it easier to scale successful pilots.
This guide is written for energy producers, distribution companies, energy-intensive industrial businesses, data centre investors and corporate transformation teams. It assesses the global picture together with data from Türkiye and explains use cases, technical requirements, governance and first steps. The information cut-off date is 22 September 2026.
Key decisions for energy executives
- Tie the first investment to a problem whose cost and data are visible. Generation forecasting, maintenance of a specific equipment class or access to technical documentation can be suitable starting points.
- Define separate responsibilities for the forecasting model, the decision recommendation and the physical command. Model success is not sufficient grounds for granting unlimited authority to act.
- When assessing data centres, examine annual electricity consumption, peak power demand and capacity at the connection point separately.
- Compare pilot performance with the existing method. In addition to the error rate, measure imbalance cost, unplanned downtime, energy intensity or the time taken to complete the work.
- Do not use large-scale savings scenarios as a return commitment for your own business. Validate the local outcome with operational data.
Why has SI become more important in the energy sector?
Decisions in the electricity system increasingly depend on more variables. Solar and wind generation changes with the weather; electric vehicles, heat pumps and data centres affect the consumption profile. Rooftop solar, batteries and distributed generation plants increase two-way power flows at some points. Extreme weather events require a wider range of scenarios to be considered in planning and maintenance decisions.
In this environment, the questions an energy business must answer at the same time are multiplying: How much will generation change? Which equipment faces a rising risk of failure? When should the battery be used? Which connection application can be met under current grid conditions? Which time window is best for maintenance?
SI can contribute to these processes by detecting patterns, producing forecasts and examining large bodies of information. Electrical engineering, mathematical optimisation, protection systems and operator experience continue to form the foundation of any application. Well-designed integration makes these capabilities work together.
Reading the 2026 picture with the right figures
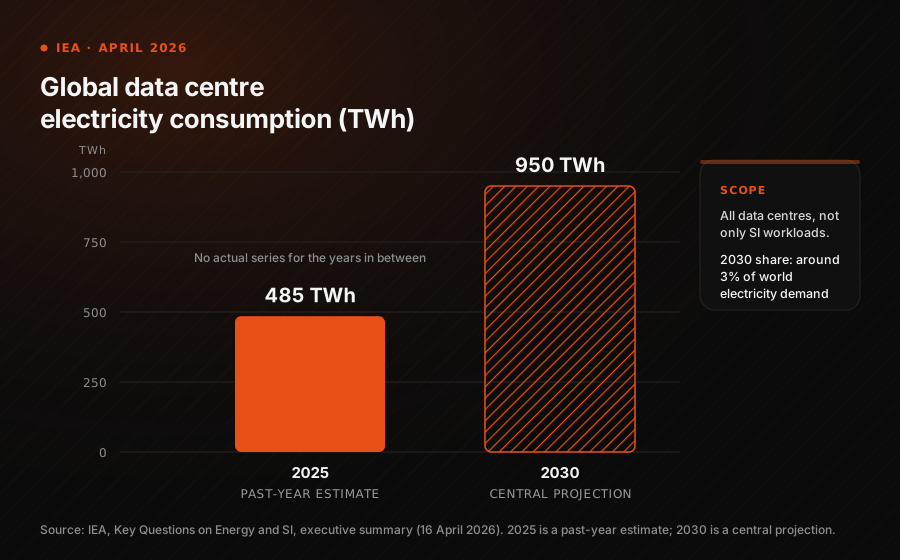
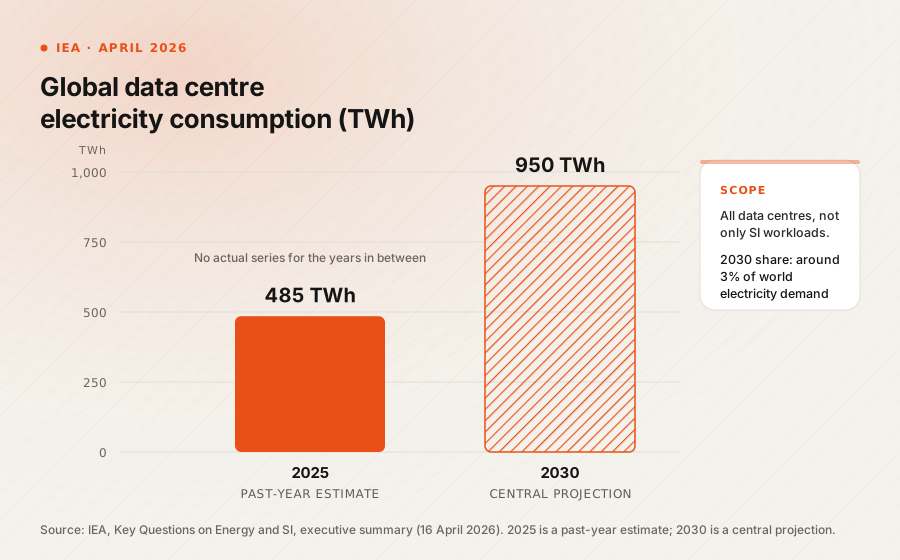
The IEA’s (International Energy Agency) 2026 assessment estimates global electricity consumption by all data centres at around 485 TWh for 2025. The central projection for 2030 is 950 TWh, which corresponds to around 3% of world electricity demand at that date. The scope is not limited to SI models; it is the total electricity use of data centres.
| Indicator | Value | How to read it |
|---|---|---|
| Global data centre electricity consumption | Around 485 TWh for 2025 | IEA estimate for a past year |
| Global data centre electricity consumption | Around 950 TWh for 2030 | Central future projection |
| Data centres’ share of world electricity demand | Around 3% for 2030 | Global average |
| Türkiye electricity consumption | 360.9 TWh in 2025 | Full-year actual |
| Türkiye installed electricity capacity | 126,944 MW at the end of August 2026 | Generation capacity at a given date |
The Türkiye data are taken from the Ministry of Energy and Natural Resources electricity outlook, updated on 18 September 2026. TWh refers to energy consumed or generated over a period, while MW refers to power. For this reason, the consumption and installed capacity figures in the table cannot be divided by one another to make a performance comparison.
A limited global share does not mean capacity is sufficient in every connection area. The impact of a large data centre should be assessed according to its location, load profile and the condition of the local grid. In an investment decision, conditions at the connection point matter as much as the national total.
The two-way relationship between SI and energy


SI for energy
This heading covers SI’s contribution to the energy value chain. Generation and load forecasting, predictive maintenance, visual inspection, energy management, customer service and making engineering knowledge accessible all fall into this group.
For example, a more accurate generation forecast at a wind farm can help the trading team update its position earlier. In a factory, an anomaly in energy consumption may point to a maintenance need or an inefficiency in the production plan. In these examples, the value comes from the link built between the forecast and the operational decision.
Energy for SI
This heading addresses how the energy needs of SI infrastructure will be met. Data centre site selection, electricity connection, cooling, redundancy, storage and workload planning should be considered together.
A model completing a single task with less energy does not necessarily mean total facility consumption will fall. The number of users, the complexity of the workload or the number of repetitions may increase. That is why resource use per successfully completed task should be tracked alongside total consumption.
The question that unites the two agendas is this: how do we measure the operational benefit SI provides together with the infrastructure and resources required to run it? A sound investment assessment answers this question at project level.
Main use cases of SI in the energy sector


Electricity demand and renewable generation forecasting
Demand forecasting draws on variables such as historical consumption, temperature, the calendar, economic activity and customer behaviour. Solar and wind generation forecasting adds meteorological measurements, weather forecasts, plant characteristics and equipment availability.
A sound system does not present just a single number. It also shows the uncertainty range of the forecast and the conditions under which its reliability decreases. Because the trading team and the maintenance team may need different time horizons, model design should follow the way the decision will be used.
In the case of solar generation, cloud cover, panel temperature, soiling, inverter constraints and planned outages all matter together. Better weather forecasts do not deliver a proportional gain in generation forecasts unless all of these variables are processed correctly.
When measuring success, deviations during high-price periods and imbalance cost should be tracked in addition to technical metrics such as mean absolute error. For solar plants whose output approaches zero at night, percentage error measures can be misleading, so the measurement method should be chosen to suit the structure of the data.
Predictive maintenance and asset management
Predictive maintenance aims to assess the risk of failure or performance loss in advance, based on the current condition of the equipment. For turbines, pumps, compressors, transformers and other critical assets, vibration, temperature, pressure, current and maintenance history can be used together.
Generating an alarm is not a business outcome in itself. It should be clear which equipment the alarm relates to, why it matters, how early it was generated and who will review it. When the maintenance record is closed, the result obtained should also be fed back into the model and the evaluation process.
Two types of error are managed together here. Too many false alarms can send teams on unnecessary inspections. Missing a critical failure, on the other hand, can lead to lost generation or greater damage. The evaluation should therefore not be reduced to an overall accuracy percentage alone.
Suitable indicators are the confirmed alarm rate, missed critical events, time gained for intervention, hours of unplanned downtime and maintenance cost per asset. For rare failures, a short pilot may not be able to prove the economic benefit conclusively; the observation period should be set according to the behaviour of the equipment.
Field inspection with computer vision
Images from drones, thermal cameras and fixed cameras can be used for the initial review of hot spots on solar panels, damage to line components or changes around equipment. SI can rank the areas within a large volume of images that experts should look at first.
A successful application links the finding in the image to the correct asset ID and location. The date of the inspection, the capture conditions and the difference from the previous observation become visible. Once the field team confirms the finding, the maintenance process begins.
A model may mistake a shadow in an image for damage, or lose performance in different weather conditions. It should therefore be tested across different seasons, equipment types and image qualities. As much as the number of kilometres or images inspected, what matters is the cost of a confirmed finding and the rate at which findings turn into field interventions.
Smart grids and capacity optimisation
SI-supported analysis can help assess load growth, possible congestion and situations approaching equipment limits in advance. When this information is used together with power flow calculations and operating rules, planning options can be compared more quickly.
Dynamic Line Rating is one of the methods that assesses the carrying limit of a transmission line according to environmental and operating conditions. Sensors and weather information can support a more up-to-date capacity calculation. Not every application of the method involves SI.
The 115–175 GW range in the IEA’s 2025 study is the global transmission capacity potential that could be assessed on existing lines. It is not new generating capacity or electricity actually generated. Implementation requires monitoring, validation, communications and operating arrangements.
The same discipline applies to topology optimisation, which changes the switching configuration of the grid. The model’s recommendation should be assessed against voltage and thermal limits and fault scenarios. It is not correct to generalise a gain calculated in one scenario to the entire grid.
Self-healing grids and FLISR
FLISR refers to the processes of locating a fault, isolating the faulted section and restoring power to suitable areas. These functions can be carried out by automation and control systems; not every FLISR application uses SI or a large language model.
In some architectures, SI can contribute to classifying the event, ranking fault probabilities or evaluating restoration options. Protection coordination, equipment limits and safe switching conditions, however, remain in force.
Projects of this kind can track indicators such as SAIDI, the average interruption duration per customer, and SAIFI, the interruption frequency. When evaluating results, weather conditions, physical grid investments and event classification should be taken into account. Attributing the entire improvement to a single algorithm may be wrong.
Battery storage and virtual power plants
In battery energy storage systems, the decision is not limited to buying electricity at a low price and selling it at a high price. State of charge, round-trip efficiency, degradation, connection capacity, reserve requirements and contracts must all be considered at the same time.
SI can provide price or generation forecasts, while an optimisation layer can turn these forecasts into an operating schedule within physical and commercial limits. The same battery capacity cannot be allocated to more than one service simultaneously and unconditionally. When revenue streams are combined, technical eligibility and market rules should be checked.
A virtual power plant enables the coordinated management of distributed energy resources. Rooftop solar, batteries, flexible consumption and suitable electric vehicle infrastructure can be assessed within a shared portfolio. Such a structure requires reliable communications, metering, contracts and participant consent.
The indicators to track are available flexibility, activations delivered, net revenue, battery degradation cost and customer service level. An application that increases flexibility must continue to meet the user’s core needs.
Energy trading and risk management
SI can contribute to the assessment of energy portfolios by processing price, generation and demand forecasts together. Day-ahead planning and intraday position updates involve different decisions. The product structure, trading times and settlement rules of the relevant market should be clearly defined in the model design.
A solution developed for the EPİAŞ markets in Türkiye should not automatically assume another country’s product intervals or price rules. Alongside forecast quality, transaction costs, liquidity, collateral requirements and extreme market conditions should be taken into account.
In backtests, using data that was not yet known at the moment of the decision creates an appearance of success that cannot be achieved in reality. Tests should be run with the information that was available at that point in the past, and repeated across different price regimes and unusual periods.
For financial performance, net result, imbalance cost and downside risk are tracked together. When live trading authority is defined, limits, approval thresholds and a stop mechanism are set. An SI forecast cannot be presented as a guarantee of profit.
Energy efficiency and customer experience
Energy management in industrial facilities and buildings requires the production plan, equipment load, temperature, hours of use and comfort needs to be assessed together. SI can flag unnecessary consumption or suggest suitable operating schedules. In energy-intensive industrial businesses, this topic should be considered together with the process and quality data covered in the guide to SI integration in the manufacturing industry.
A fall in a factory’s total electricity consumption is not in itself proof of efficiency if production volume has also fallen. Measurement should be made together with variables such as energy per unit of output, production quality and weather conditions. In buildings, energy gains should be assessed together with comfort and indoor environmental quality.
On the customer side, SI can be used for work such as explaining bills, interpreting consumption patterns, classifying applications and routing them to the right team. Success should be measured by accuracy, first-contact resolution, handover to human support and complaint closure, as much as by the number of responses.
Where loss or irregular use is suspected, the model output should be treated as a signal for review. A faulty meter, a data outage or a legitimate change in consumption can also create an anomaly. Decisions that affect consumers should be carried out with appropriate verification and appeal processes.
What do digital twins offer energy companies?
A digital twin is a digital model that represents the behaviour of a physical asset or system and is linked to current data. In the energy sector, it can be used to compare planning options, evaluate maintenance scenarios and examine the possible consequences of changes.
The digital twin of a transformer and the digital twin of a distribution grid do not have the same scope. In the first, the thermal behaviour and ageing of the equipment may come to the fore. In the second, topology, load, generation and connections are addressed together. Before a project starts, the decision the model will support should be defined.
A good digital twin answers these questions: When was the data updated? How far does it differ from the physical system? In which scenarios has it been validated? For which decisions can it be used? A model running on the wrong topology or outdated equipment parameters may not provide reliable decision support, even if it produces detailed visuals.
Initiatives such as TwinEU in Europe are researching how local digital twins from different organisations can work together. The organisational counterpart of this approach is agreeing on shared data definitions, access rights and model boundaries. One organisation developing a digital twin does not mean the entire ecosystem has moved to a single model at once.
How can agentic SI be applied in the energy sector?
Agentic SI refers to systems that plan more than one step towards a goal and can move a workflow forward using permitted tools. In the energy sector, this approach can be considered for gathering maintenance knowledge, correlating events, preparing reports and work order processes.
For example, after receiving an anomaly from a piece of equipment, a maintenance agent can find the relevant maintenance history and the current manufacturer instructions. It can rank possible causes with their sources, check stock information and prepare a draft work order. Once the authorised engineer has completed the review, the approved record can be entered into the relevant system.
For this flow to be reliable, the agent must identify the correct asset, access only the records it is authorised to see and avoid producing definitive conclusions from incomplete information. Preventing duplicate orders when an action is repeated is also part of the design.
| Level of authority | Example task | Condition for use |
|---|---|---|
| Reading information | Searching maintenance records and procedures | User-based access and source citation |
| Preparing recommendations | Possible cause and draft work order | Expert review and uncertainty information |
| Taking limited action | Transferring an approved record to the system | Permitted tools, action log and repeat check |
| Affecting the physical system | Change of operating point or switching | Independent safety assessment and validated control architecture |
A general-purpose language model should not be given direct and unlimited write access to SCADA or PLC systems. The layers for generating recommendations, authorisation and control should be clearly separated.
Human oversight does not mean that every action is approved one by one by a person either. Protection functions that operate in milliseconds cannot be run this way. In such functions, tested protection and control systems do the job. The architecture should be designed with independent controls that prevent SI outputs from exceeding these safety boundaries. For decisions with longer time horizons and high impact, the authorised person is given the context and time needed for a meaningful review.
Current implementation examples
Energy-relevant weather data with Google WeatherNext 3
Google’s WeatherNext 3 announcement of 3 September 2026 highlights hourly refreshed forecasts along with variables useful for energy, such as wind speed at 100 metres height, cloud cover and solar radiation. Resolution varies by variable.
For energy businesses, the takeaway is to test a new meteorological model at their own plants rather than treating it directly as commercial success. An assessment carried out with local measurements, the plant power curve and equipment availability reveals the model’s real contribution.
Shared grid data with Siemens and Alliander
According to Siemens’ statement of 5 May 2026, Alliander is bringing its own applications together with a shared grid model on Gridscale X. The statement reports that 85 applications have been moved to the platform and that a 30% simplification has been achieved in the IT landscape. This rate should not be interpreted as an increase in grid capacity.
The implementation principle the case points to is clear: when different teams can access the same asset and connection information, models become more usable. Buying a new algorithm on its own does not resolve the mismatch between data and applications.
Scaling maintenance with Shell and C3 AI
C3 AI’s announcement of 4 June 2026 reports that more than 13,000 pieces of equipment are monitored in the predictive maintenance programme run with Shell. The expanded collaboration also covers agent-assisted root cause analysis and remediation capabilities.
This announcement offers an example of maintenance analytics being applied across large asset portfolios. The number of monitored assets does not mean that all equipment is managed by autonomous agents, or that the same financial result will be achieved at another business.
Connection planning with Portland General Electric and GridCARE
Portland General Electric’s 2026 corporate disclosure states that more than 80 MW of near-term grid capacity has been made available as part of the work carried out with GridCARE. PGE here is a different company from PG&E in California.
This example points to assessing load analysis and flexibility together in capacity planning. The reported value is connection capacity; it is not new electricity generation or consumption realised over a full year. The equivalent of a similar approach on another grid is determined by connection conditions and flexibility agreements.
The numerical statements in these cases are based on the disclosures of the companies or technology providers concerned. Organisations should carry out field validation of a similar scope when assessing their own investments.
The current outlook for SI in Türkiye’s energy sector
Türkiye’s electricity generation in 2025 was reported as 362.9 TWh. In the same year, wind accounted for 10.9% of generation and solar for 10.5%. Adding the ministry’s rounded shares, the two sources contributed around 21.4% of generation.
At the end of August 2026, solar’s share of installed capacity was 22% and wind’s share was 12.2%. Together they come to around 34.2%. Generation share and installed capacity share are different indicators, and they do not represent the same period.
This picture explains why generation forecasting and flexibility management matter more. Operational value comes not only from a portfolio’s total installed capacity, but also from how much it can generate at which hours and how accurately it can predict that output.
The energy link in Türkiye’s SI Action Plan
Türkiye’s AI Action Plan, announced on 13 June 2026, covers the 2026–2030 period. The official announcement includes targets to reach at least 1 GW of installed data centre capacity by 2030 and to mobilise at least $10 billion in predominantly private sector funding for data centre, cloud and SI infrastructure.
These figures should not be read as existing capacity or money already spent. The question energy businesses need to assess is how potential data centre investments will be matched with site selection, connection capacity, efficiency and electricity supply plans. A target stated in GW cannot be converted into annual TWh consumption without knowing the utilisation rate and scope.
Governance and data readiness in local applications
Kazancı Holding’s EnergyMind statement of 25 June 2026 covers work assessing the SI and data analytics maturity of distribution companies. It is an example showing that implementation readiness and risk planning have also entered the transformation agenda in Türkiye. The statement does not, on its own, provide a measured reduction in failures or a cost-saving rate.
Enerjisa’s Responsible AI Governance Policy defines transparency, privacy, accountability and human oversight appropriate to the context of use. The existence of such a policy is valuable for defining organisational responsibilities; operational success should still be measured by implementation results.
The shared need for teams developing projects in Türkiye is to combine meter, maintenance, customer and grid data with the right permissions, keep the relevant market rules up to date and assess data protection requirements at the start of the design.
Data and system architecture required for technical integration


In energy companies, data is often held in different systems and at different levels of detail. The same piece of equipment may be registered under one ID in the maintenance system and another in the geographic information system. Measurement timestamps may not match. These differences need to be resolved before model development; the core steps of data analysis with SI apply here too.
| Data group | Main sources | Priority check |
|---|---|---|
| Operational data | SCADA and time series records | Time alignment, latency, missing measurements |
| Asset and maintenance information | Asset management and work orders | Unique ID, failure class, record accuracy |
| Grid model | Geographic information and connection records | Current topology and equipment parameters |
| Generation and environment | Plant measurements and meteorology | Spatial alignment and data version |
| Commercial data | Market, contract and cost records | Availability at the moment of decision |
| Organisational knowledge | Procedures and technical manuals | Validity date and access rights |
In the architecture we recommend, data collection, modelling, decision evaluation and action execution carry separate responsibilities. The data layer makes the source and quality visible. The model layer produces a forecast or recommendation. The decision layer evaluates it against operating rules and physical constraints. The action layer carries out only authorised actions.
Monitoring should accompany every layer. It is recorded which model version produced a result with which data, which decision was applied and what the outcome was. The fallback method for when the data flow breaks down or the model loses reliability is defined in advance.
The choice between cloud and on-site systems is also made according to the requirements of the use case. Local operation becomes important if low latency, continuity during a loss of connection or keeping data on site is required. Moving all data to a central cloud is not mandatory.
Which SI model suits which problem?
In energy, model selection should follow the structure of the task. Time series forecasting, image review, document search and physical control require different validation methods.
In demand or generation forecasting, it is useful to set up a simple baseline method first. The contribution of more complex machine learning models is compared against this method. When data is scarce or operating conditions change frequently, a complex model will not always produce better results.
Technical document assistants can use the RAG approach, which supports a large language model with organisational sources. The system should show the relevant document, version and section along with the answer. RAG does not completely eliminate the likelihood of wrong answers; access control, evaluation and, where necessary, the ability to decline to answer are still required.
Physics-informed models aim to add physical relationships to the learning process. Physics-informed neural networks, known as PINNs, are one of the approaches in this field. They are being studied in research on specific power system problems. Using physical equations in training does not guarantee safe results under every condition or immunity to cyber attacks.
Explainability tools can help understand which inputs a model is sensitive to. However, producing an explanation does not prove that the decision is causally correct or physically safe. The explanation should support independent validation and operational assessment.
How do you measure whether a pilot has succeeded?
A good pilot tests a defined business decision, going beyond a technology demonstration. At the outset, current performance, the comparison method, the measurement period and the acceptance conditions should be set.
In forecasting projects, it is important to split the data while preserving its time order. Future records leaking into training or evaluation lets the model draw on information it could not access in reality. Different seasons and periods of extreme weather should also be included in the evaluation.
In maintenance projects, confirmed findings and intervention outcomes should be tracked instead of the number of alarms. For document assistants, reliance on the correct source, version accuracy, not showing unauthorised content and recognising missing information should each be tested separately.
| Evaluation area | Question to answer |
|---|---|
| Technical quality | Under which conditions does it produce better results than the current method |
| Business outcome | What is the measured contribution to cost, time or reliability |
| Safety | How does the system behave when incorrect or incomplete data arrives |
| Usability | Can the operations team use the output in the real workflow |
| Sustainability | Are the maintenance, monitoring and resource costs acceptable |
The transition sequence Webtures recommends consists of historical data testing, passive monitoring on live data, recommendation generation and limited implementation, depending on the risk of the use case. A new decision is made at each stage. Moving to the next stage should not happen automatically just because the timetable has been completed.
Together with the decision points, the sequence is as follows; this flow is not a formal certification process:
- Historical data testing: if the acceptance conditions are not met, the data and model are corrected and the test is repeated.
- Passive monitoring on live data: if there is no operational and safety approval, the scope is reassessed.
- Limited implementation and monitoring: if a problem is detected, the system returns to a safe state and the scope is reassessed; if there is no problem, monitoring of the limited implementation continues.
How should SI’s energy, water and carbon impact be assessed?
The resource consumption of a system developed to save energy should also be included in the measurement. Model training, inference, data transfer, storage and operating costs are assessed according to the scope of the project.
Electricity consumption and peak power demand answer different questions. The first shows total use over a given period. The second affects connection and equipment capacity. Energy cost, carbon impact and water use are also separate indicators.
In data centres, PUE is the ratio of total facility energy to IT equipment energy. It is useful for assessing the efficiency of cooling and auxiliary systems. However, a low PUE does not on its own show that a model solves the same task more efficiently or that the facility’s total electricity use has fallen.
In water assessment, water withdrawn by the facility and water consumed should be distinguished. Direct cooling water at the facility and indirect water linked to electricity generation should be reported separately. The cooling architecture, water source, season and local basin conditions affect the result. Using liquid cooling does not in itself mean high or low water consumption.
In carbon assessment, where and when the electricity is generated and the calculation method chosen also matter. A renewable energy supply contract does not mean that the facility is physically powered only by renewable sources every hour.
The following measurement set can be applied to a project: compute cost per successfully completed task, energy per task where possible, total workload, number of repetitions and comparable operational output. Reporting energy, carbon and financial benefit separately makes it visible where the improvement comes from.
Cybersecurity and operational safety
In energy systems, a cybersecurity incident can affect physical processes. SI integration therefore requires a joint assessment by information technology and operational technology. It should be clear which network, data and tools the model can access.
NIST’s guide to operational technology security and the IEC 62443 series offer useful frameworks for risk assessment and industrial system security. These frameworks do not show that any SI product is secure by default; they must be applied to the organisation’s architecture and responsibilities.
In SI projects for energy, access should be limited to the level the task requires, critical networks should be appropriately segregated and action logs should be protected. Corruption of the data source, a wrong asset ID, a communications outage and changes in model behaviour should be tested together.
In systems that use a language model, the possibility of an external document or message steering the agent towards unauthorised actions should also be considered. Document content should not be accepted as an instruction that changes the system’s authorisation policy. Tool permissions should be enforced independently of the text the model produces.
Safe-state fallback, stop and rollback mechanisms are defined for critical decisions. For actions whose physical effect cannot be reversed, the check is made before execution. The move to the production environment should take place with the validation of the relevant engineering and operations owners.
Regulation and corporate governance
In the EU AI Act, the intended purpose is decisive
The EU AI Act treats certain SI systems designed to be used as safety components in the management of electricity, gas, heating and water supply as high-risk. Not every SI application in an energy company automatically falls into the same class. The system’s function, its impact and its relationship to the geographical scope of the legislation should be assessed separately.
According to the European Commission’s latest statement, following the AI Omnibus that entered into force on 27 July 2026, the application date of the high-risk provisions under Annex III has moved to 2 December 2027, and the date for high-risk systems integrated into relevant products has moved to 2 August 2028. This change does not mean that all AI Act provisions have been postponed.
Energy companies should build an inventory of applications and record provider and deployer roles, data flows, intended use and owners. When an organisation operating in Türkiye assesses the EU scope, it needs to look at concrete conditions such as where the system is placed on the market and where its outputs are used, not only at the commercial relationship.
Data protection and sector responsibilities in Türkiye
Smart meter and customer data can allow inferences about people’s behaviour. The purpose of processing, the amount of data required, access, retention and transfer conditions should be assessed at the start. The generative AI guide from KVKK, Türkiye’s Personal Data Protection Authority, is one of the institutional resources that can be used in this assessment.
In the governance model, the business unit, energy engineering, the data team, cybersecurity, legal and risk management should work together. Each use case should have a process owner and a team responsible for monitoring the system in the production environment. A policy document should be backed by responsibilities that have a counterpart in day-to-day operations.
How is the return on an SI investment calculated?
The investment calculation starts with the current cost of the process to be improved. In a forecasting project, the reference may be imbalance cost; in a maintenance project, unplanned downtime and intervention cost; in a document assistant, the time spent completing the work.
The total cost calculation should include data preparation, integration, sensors, software, compute, cybersecurity, training, monitoring and ongoing maintenance. Leaving the manual work done by experts during the pilot out of sight makes the scaling cost look lower than it is.
Time saved in the workforce does not automatically create an equal amount of cash savings. A team doing more work, spending less time on fixing errors or needing less outsourcing are different economic outcomes. Each should be shown separately.
An example investment calculation
The figures below have been created only to illustrate the calculation method; they are not a Webtures client result or a sector average.
Assume that a business’s annual cost for the relevant process is TRY 10 million. If the improvement validated over comparable periods reduces this cost by 6%, the annual gross benefit is TRY 600,000. If the solution’s annual operating cost is TRY 240,000 and the initial investment is TRY 480,000, the annual net operating benefit is TRY 360,000.
Under these simplified assumptions, the simple payback period is 480,000 / 360,000, or around 1.33 years, which is 16 months. The calculation assumes that the benefit accrues at a constant rate after the solution goes live and that it is permanent. Tax, financing, exchange rates, the time value of money and changes in scale are not included. In a real investment decision, these and adverse scenarios are assessed separately.
The same benefit must not be counted twice. If the economic value of a prevented outage is added under both increased output and reduced losses, the return on investment appears higher than it is. For a deferred infrastructure investment, the full cost of the project should not be booked as savings either.
An actionable roadmap for the first 90 days


The aim of the first 90 days is not to make the organisation’s entire energy system autonomous. It is a starting programme for choosing a measurable use case, preparing the required data and basing the decision to continue on evidence. Some projects may take longer because of missing data, seasonality or safety assessment.
| Period | Work to be done | Expected output |
|---|---|---|
| First 15 days | Review the process, cost, responsibilities and current applications | Problem definition and baseline measurement |
| Days 16–30 | Data quality, access and risk assessment | Data preparation plan and pilot acceptance conditions |
| Days 31–60 | Compare the baseline method and candidate model on historical data | Technical test and error analysis |
| Days 61–90 | If suitable, passive monitoring on live data and user assessment | Decision to continue, correct or stop |
At the start, an end-to-end assessment of a use case with a clear process owner is more useful than producing several small demos. For example, instead of only generating maintenance alarms, reviewing and recording the alarm can also be made part of the pilot.
Before the scaling decision, the continuity of the data flow, the model’s behaviour under different conditions, users’ ability to understand the output and the affordability of the operating cost should be established. If the evidence of benefit is insufficient, the project can be redesigned; the failure of the first model does not show that the whole use case is worthless.
Questions to ask when selecting technology and implementation partners
A product’s SI label is not enough to evaluate a solution. Testing with the organisation’s own data, integration conditions and responsibilities in the production environment should be examined.
- Is there a verifiable implementation example for the same problem and a similar asset type?
- Under which conditions does the model outperform the existing simple method?
- How does the system warn and fall back when data quality deteriorates?
- Who is informed, and which tests are repeated, when the model or API version changes?
- Can data, records and organisation-specific outputs be moved to another solution?
- Can the operations team explain the decision and stop the application when necessary?
- Who is responsible for monitoring, maintenance and security after deployment?
Sector-specific control and asset management platforms can be used together with organisation-specific forecasting and knowledge applications. The build-or-buy decision depends on which component creates a competitive advantage and whether the organisation has the capability to sustain it.
How should people and the operating model change?
SI projects in energy require data specialists and field teams to work together. Domain knowledge is needed to understand whether an unusual movement in sensor data signals a maintenance need or an operational change. The screen the operator uses and the time available for a decision matter as much as the model.
Training programmes should not only teach people how to use a tool. Employees should be able to recognise model limits, verify sources, interpret uncertainty and report faulty recommendations. The competence needed to return control to manual methods when required should be preserved.
On the management side, success must be owned. The business owner of the process tracks the expected benefit, the engineering team the operating conditions, the data team model performance and the security team access limits. A pilot that leaves the system in the production environment without an owner does not create lasting value, even if it is technically successful.
The future of energy and SI on the road to 2030
Developments in 2026 offer signals about the areas in which the transformation may advance. They are not outcomes that will happen at the same pace for every organisation. Data quality, physical investments, regulation and financing conditions will continue to be decisive.
The data link between planning and operations may strengthen
Shared asset and grid models can allow maintenance, connection planning and daily operations to work with more consistent information. The lasting advantage in this area will be the currency of the organisation’s own data and its integration with decision processes.
Data centre flexibility may become more valuable
Some computing work can be shifted in time or location, while some is sensitive to latency. Measuring how much each load can flex can contribute to the energy system through suitable contracts. It should not be assumed that all data centres have the same flexibility capacity.
SI agents may spread across defined workflows
Agents that combine several steps can be used in processes such as maintenance preparation, technical research, incident analysis and reporting. The condition for wider adoption is authority limits and the traceability of actions. Avoiding wrong actions should be a performance indicator as much as completing the work.
Energy data sharing and interoperability may gain importance
The European Commission’s energy digitalisation and AI roadmap of 3 June 2026 addresses the integration of data centres, the use of SI in energy and secure data sharing together. This direction points to the need for businesses to strengthen their data definitions and their connections with external systems.
The Webtures assessment is that, in the period ahead, advantage will depend less on the number of models in use and more on the quality of validated decision processes. When organisations build an operating model that protects their own data, transfers field knowledge into processes and measures results regularly, they can evaluate new technologies more soundly.
Frequently asked questions
What is SI used for in the energy sector?
It can be used in areas such as generation and consumption forecasting, early assessment of equipment failures, visual inspection, energy management and access to technical knowledge. Its contribution is determined by which decision the output improves and how the result is measured.
Does SI reduce energy consumption?
It can in suitable processes. However, computing infrastructure also consumes energy, and the volume of use may increase. The result should be measured against comparable production or service output, and energy, cost and carbon impact should be assessed separately.
Are a smart grid and SI the same thing?
No. A smart grid covers metering, communications, automation and control capabilities. SI is one of the methods within this structure that can provide forecasting and decision support. Not every smart grid function requires SI.
What is the difference between a digital twin and a dashboard?
A dashboard visualises current or historical information. A digital twin models the behaviour of the system it represents and can also allow specific scenarios to be evaluated. Its usefulness depends on model accuracy, currency and the scope of decisions it was designed for.
Where can energy companies use large language models?
Technical document search, summarising maintenance records, classifying customer applications and preparing reports are suitable areas for evaluation. Source accuracy, access rights and human review should be designed according to the impact of the use case.
What data should an SI project in the energy sector start with?
The problem should be defined first. Forecasting requires generation, consumption and weather data; maintenance requires sensor and work order history; a technical assistant requires current and authorised documents. Asset IDs, timestamps and accuracy matter as much as the volume of data.
How long does a pilot take?
The duration depends on data preparation and the risk of the use case. The first 90 days can be a starting programme covering problem and data assessment and a controlled test. Seasonal forecasting or rare-failure projects may need a longer observation period.
Will SI replace energy engineers?
It can speed up some information-gathering and analysis tasks. Defining the limits of the physical system, carrying out safety assessments and bearing operational responsibility, however, require domain expertise. Engineers’ knowledge and decision-making authority should have a clear place in project design.
Is every energy SI application high-risk under EU legislation?
No. Classification is based on the intended use and the function of the system. A system used as a safety component and an internal document assistant may not be subject to the same assessment. The scope of the legislation and the current timetable should be examined for the specific application.
Setting implementation priorities with the Webtures approach
In an energy company’s SI roadmap, the starting point is a clear definition of the decision to be improved. Where the data will come from, who the output will reach and how the business outcome will be verified should be addressed within the same piece of work.
The approach Webtures recommends is to assess strategic prioritisation, data preparation, workflow design and performance measurement together. Components that require energy engineering, physical safety and field control should be carried out within a joint scope with the business’s authorised teams and relevant specialists.
The first concrete output should be a roadmap that shows the organisation’s most valuable use cases and, for each one, defines the data requirement, the owner, the success criterion and the limits of implementation. This way, technology selection becomes a decision that meets the business’s real needs.
Let’s assess together in which processes SI can create measurable value for your energy company.