

Conversion rate optimization is the combined use of research, measurement, hypotheses and experiments to increase the share of users who complete a meaningful goal on a website or digital product. The goal can be a sale, a qualified enquiry, a subscription, a product activation or a booking. Success is not more button clicks; it is an outcome that meets a user need and creates business value.
In the SI era, CRO widens into three areas: improving research and experimentation with SI tools; improving the decision experience of people arriving from SI assistants; and making sure authorised agents complete tasks such as product comparison, form filling or purchase correctly. These areas can run in one program, but they are not judged with the same data or the same success measure.
This guide covers everything from calculating a conversion rate to advanced experiment design, and from click-through improvement to SI referrals and agent transactions.
What Is Conversion Optimization?
Conversion optimization is the systematic improvement of an experience so that a larger share of existing demand turns into the right business outcome. It is abbreviated as CRO.
On an e-commerce site the goal may be choosing the right variant and completing payment; on a B2B site, creating a demo request that fits the need; in a software product, the user completing their first valuable action. A form that appears submitted and a valid request that reaches the CRM are also two different events.
The scope of CRO includes:
- Researching user needs and decision barriers.
- Verifying the conversion definition and data quality.
- Identifying product, offer, content and interface problems.
- Developing testable hypotheses.
- Evaluating changes with an appropriate method.
- Reading results together with business quality, revenue, cost and user experience.
CRO does not eliminate traffic or software cost. It aims for a more efficient outcome, and it needs resource for research, development, tooling and maintenance.
How does CRO differ from UX, SEO and GEO?
| Area | Core question | Relationship with CRO |
|---|---|---|
| SEO | Is the content findable in search and does it meet the need? | Helps qualified organic demand reach the right page. |
| GEO / SI visibility | How is the brand or content represented in specific SI answers? | Helps you understand the visitor's expectation and prior research context. |
| UX | Can a person complete the task easily, clearly and accessibly? | Surfaces conversion barriers through research and design. |
| CRO | Does the change improve the defined goal and business quality? | Produces decisions through measurement and suitable experiment design. |
| Agent Experience | Can an authorised agent complete the specific task correctly? | Evaluates agent interaction, errors, transactions and handover to a human. |
These areas do not replace one another. Being cited is not a sale, and the presence of an accessible form does not on its own prove that more qualified demand was produced.
What Is a Conversion Rate?
Conversion rate is the ratio of units that completed a defined goal to the total units evaluated in the same scope. It is abbreviated as CVR. Whether the unit is a user, a session, an ad interaction or a task changes the result, and the report must state which one was used.
A user visiting three times and buying once affects user-based and session-based rates differently. Two orders in the same session also require a distinction between "two orders" and "one session that ended in a purchase".
What are macro and micro conversions?
A macro conversion is the direct business outcome of the program: a confirmed order, a qualified enquiry, a paid subscription or a completed booking.
A micro conversion is a progress indicator on the way there: comparing products, adding to basket, watching a demo video, starting a form or moving to the pricing page.
Counting every micro interaction as the main conversion can make a report look better than reality. If form starts rise while valid submissions fall, the flow has not improved. A visit from an SI assistant, or an agent crawl, is not a conversion by itself.
How Is Conversion Rate Calculated?
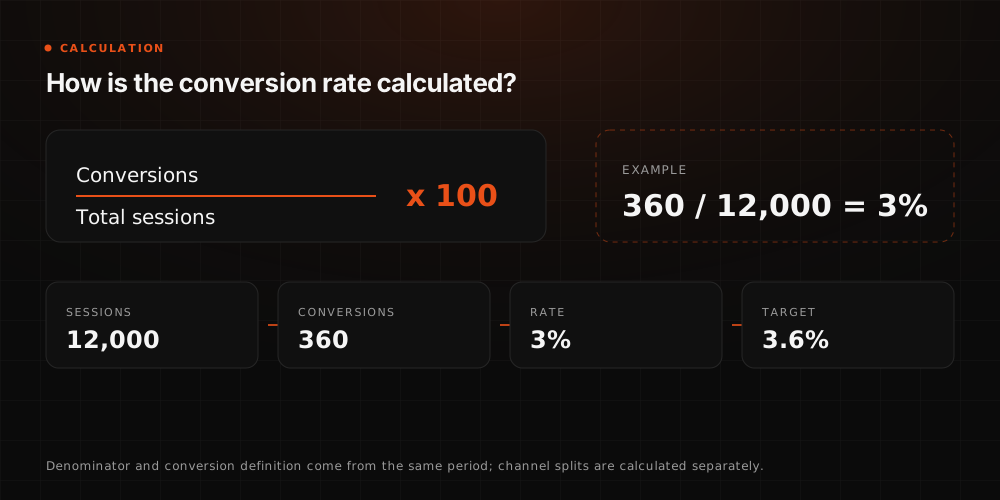
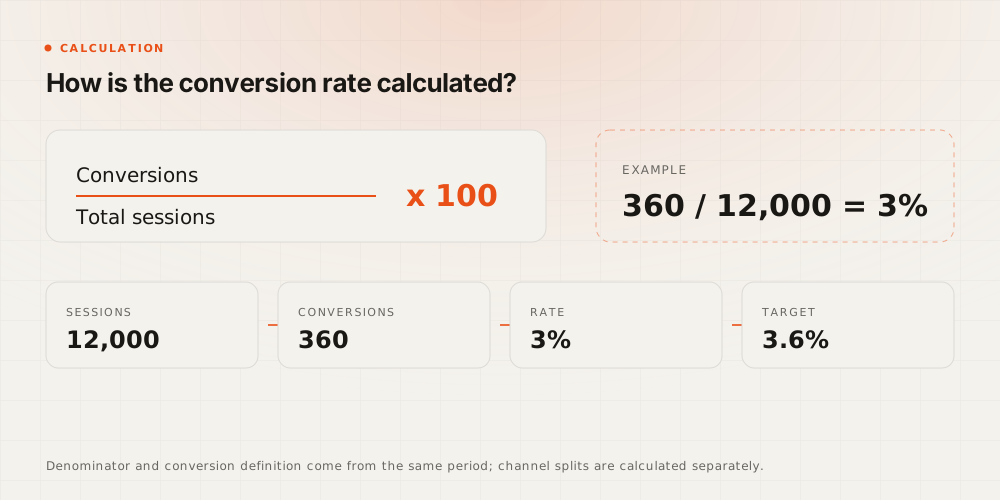
The basic logic is:
Conversion rate (%) = units that completed the goal ÷ eligible total units × 100
Before applying the formula, the goal, unit, period and included traffic have to be defined. For users or sessions this approach counts whether the unit completed the goal at least once. Ad platforms also use a different definition where more than one conversion can be counted per interaction.
| Measure | Numerator | Denominator |
|---|---|---|
| User-based conversion rate | Unique users who completed the goal at least once in the period | Unique users in the same period and scope |
| Session-based conversion rate | Sessions in which the goal occurred at least once | Total sessions in the same scope |
| Ad interaction conversion rate | Conversions according to the platform counting rule | Eligible ad interactions in the same scope |
| Form completion rate | Valid completions out of started forms | Form starts as defined |
| Agent task success rate | Successful tasks with a verified outcome | Started tasks within scope |
In Google Ads, if more than one conversion is counted per interaction the ad conversion rate can exceed 100%. That is not the same metric as the share of users or sessions that succeeded; the counting setting has to be stated in the report. Google Ads conversion rate definition.
GA4 reports user-based and session-based key event rates separately. Measuring a specific key event is also different from measuring whether any key event happened. The report field used must match the conversion definition. Google Analytics metric definitions.
A worked conversion rate example
Assume that in one month, 50 out of 1,000 eligible sessions contained at least one valid order:
50 ÷ 1,000 × 100 = a 5% session-based purchase conversion rate.
If those 50 sessions contained 55 orders in total, 55 ÷ 1,000 gives 5.5%, but that is not the share of sessions that purchased. It is a different metric, orders per session.
Measurement errors, internal traffic, test transactions and identifiable automation traffic have to be handled up front. For traffic that cannot be identified, state the limit of the measurement rather than claiming a perfectly clean dataset.
Is a percentage increase the same as a percentage point difference?
If the conversion rate goes from 2% to 3%:
- The absolute change is 1 percentage point.
- The relative increase is 50%:
(3 − 2) ÷ 2 × 100.
If a starting rate is zero, the relative increase cannot be calculated by division. Report the absolute change and the conversion counts. Showing only a high relative percentage is misleading, especially on small samples.
Why Is Conversion Optimization Needed?
Buying more traffic can amplify a problem that already exists in the flow. If the user cannot understand the price, cannot find the delivery terms or hits a form error, new visits will meet the same barrier. CRO investigates what that barrier is and which change actually works.
Why does the conversion rate matter?
The rate is an indicator that has to be read together with traffic quality, offer fit and the outcome of the experience. A high rate alone does not mean a better business result. Heavy discounting can raise orders while cutting margin; a short form can raise enquiries while sending more unqualified demand to the sales team.
The business impact of conversion rate
10,000 sessions at a 2% session-based purchase rate means 200 sessions ended in a purchase. At the same session count, a 2.5% rate means 250 purchasing sessions. Assuming one order per converting session, that is 50 additional orders. To calculate revenue impact you also have to evaluate traffic, product mix, average order value and other conditions.
This is a scenario calculation. In reality stock, cancellations, returns, discounts, cost and customer quality all vary. Estimated revenue and verified incremental revenue must be kept apart.
Advantages of a high conversion rate
More eligible visits completing the goal can make acquisition spend more efficient and put existing demand to better use. User research can feed product decisions, and an experiment archive can stop the same idea being retried repeatedly. These benefits depend on the change made and the result measured; do not assume every metric improves together.
When is CRO needed?
- Traffic is rising but sales or qualified enquiries are not rising at a similar pace.
- There is a clear drop-off at a form, basket, payment or activation step.
- Visitors arriving from an SI assistant do not find the information they expected on the page.
- People complete a task while agents get stuck on the same one.
- You do not know which option is better for a redesigned site or a new offer.
- Conversion reports do not reconcile with CRM, order or payment records.
Low traffic does not make CRO impossible. Instead of experiments that need large samples, prioritise research, usability testing, measurement fixes and resolving obvious technical faults.
What Is SI-Assisted CRO?
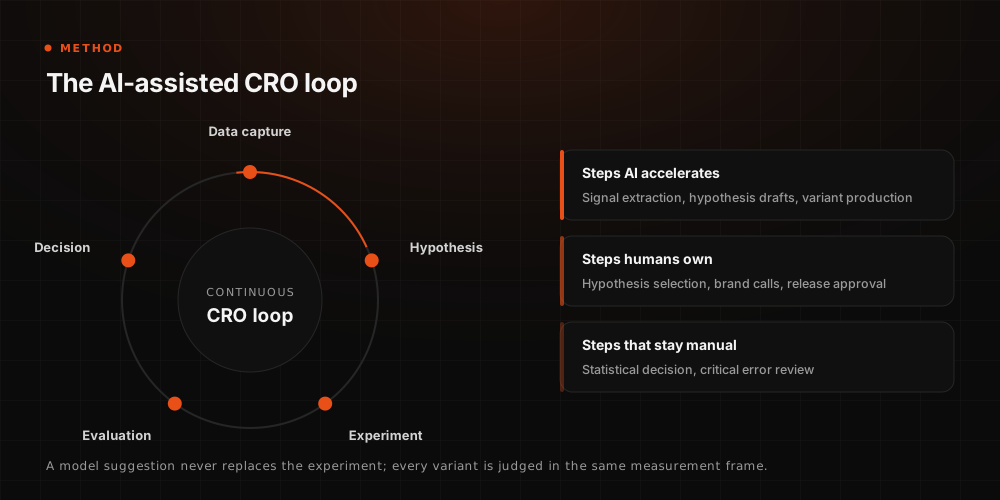
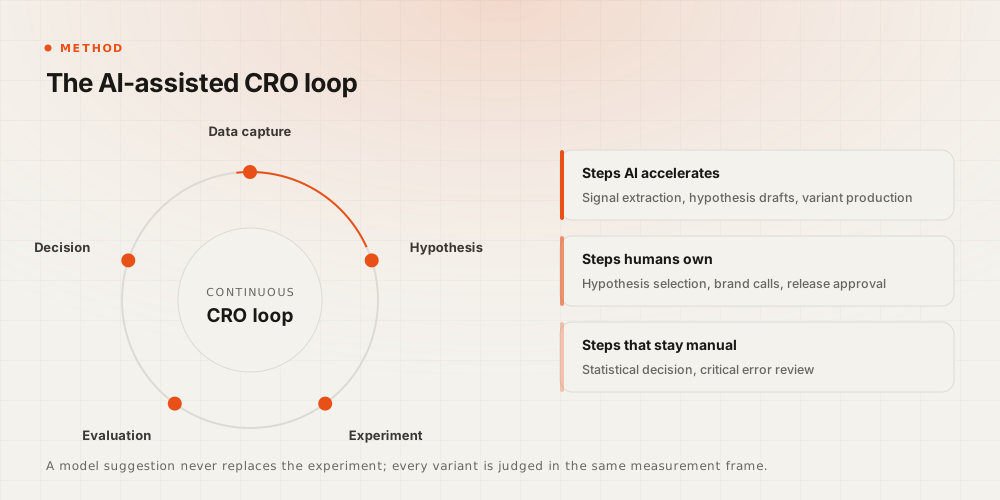
SI-assisted CRO is the use of SI tools in research, analysis, content and interface variant generation, prioritisation and parts of the decision process. An SI suggestion is a hypothesis; it does not count as a result until its effect is evaluated with a suitable method.
Three areas of work need to be kept apart in the SI era:
| Area of work | Example application | How success is judged |
|---|---|---|
| Doing CRO with SI | Clustering feedback, summarising form problems, drafting variants | Analysis quality, expert review, experiment result, time and rework |
| CRO for SI-sourced human visits | Meeting the comparison, price and evidence needs of a person arriving from SI | Qualified conversion, value and customer quality in the same scope |
| Task and transaction optimisation for agents | Improving variant selection, quote requests or an authorised transaction flow | Verified task success, errors, retries and handover to a human |
A company can also improve its own support assistant. With integration and permissions in place, model and tool logs can be accessed; scope varies by product. Do not assume access to all conversations inside an external SI platform.
What can SI speed up?
SI can do the first pass on a large volume of open-ended feedback, group different wordings of the same problem and select candidate examples for an analyst to review. It can produce design and copy alternatives and draft first checklists for technical changes.
The important point is not to lose the evidence behind the output. Instead of a generic summary such as "users do not trust us", you should be able to see which pieces of feedback support which problem. Synthetic user opinion is not a substitute for a real interview.
What SI cannot guarantee
More variants does not mean a more reliable result. SI does not make a small sample sufficient, does not reliably recover missing source data, and cannot know purchase intent from the referring domain alone. Automated personalisation can also optimise the wrong target faster.
For that reason the goal, permissions, quality criteria and the points where human review is required must be defined before the experiment.
Conversion Optimization for Visitors Arriving from SI
A person who follows a link from ChatGPT, Gemini or another assistant is still a human visitor. Some have done prior research; some are only looking for a definition or a source. Treating every SI referral as purchase-ready is wrong.
To improve, evaluate source, landing page, country, device, new versus returning user and the conversion goal together. Where possible, collect the real questions sales and support teams hear. Never imply that you can see the visitor's private SI conversation.
Which question should the landing page answer?
| Likely user need | Information the page must carry | Outcome you can evaluate |
|---|---|---|
| "Does this fit my situation?" | Use cases, cases where it does not fit, scope | Qualified enquiry or the right product choice |
| "How is it different from the alternative?" | A current, fair comparison with criteria | A meaningful action after the comparison |
| "What is the total cost and terms?" | Price and scope, delivery, fees, return terms | Drop-off and cancellation at payment |
| "How do I verify this claim?" | A real case, the method, product documentation or a source | Fewer trust questions, better-fitting demand |
| "What should I do now?" | A clear next step suited to the context | Form, booking or purchase success |
On an informational page, removing the basic definition and showing only sales proof harms the user who came for the definition. The first answer on the page must match its real intent.
Does an SI referral always convert better?
No. The result depends on category, source, period, the nature of the offer and the conversion definition. High multipliers from other studies should not be used as a target or a guarantee for your own site. With enough data, compare similar pages and segments, and always show the rate alongside conversion counts and uncertainty.
Channel mix can produce what looks like an improvement
In the example below, neither channel's own conversion rate changes:
| Period / channel | Sessions | Converting sessions | Rate |
|---|---|---|---|
| A — Organic search | 9,000 | 180 | 2% |
| A — SI referral | 1,000 | 50 | 5% |
| A — Total | 10,000 | 230 | 2.3% |
| B — Organic search | 5,000 | 100 | 2% |
| B — SI referral | 5,000 | 250 | 5% |
| B — Total | 10,000 | 350 | 3.5% |
The total rate rose, yet no channel improved its own rate. What changed was the channel distribution. Presenting a rise in the site average as the effect of a design change can therefore be wrong. This table is an illustrative calculation.
Improving Clicks and Conversions
Click-through rate shows how often content or an ad is clicked where it is seen. Conversion rate shows how far the chosen goal was achieved. The two do not measure the same stage.
CTR (%) = clicks ÷ impressions × 100
A result that earns 1,000 clicks from 20,000 impressions has a 5% CTR. If 40 of those clicks are linked to the defined conversion, then under the same scope and counting rule the click-based conversion rate is 4%. Impressions, clicks, sessions and users are not interchangeable.
Tips for increasing clicks
The title and description have to represent accurately what the user will find on the page. The product name, purpose, scope or comparison subject can be stated plainly. A promise that creates curiosity but is not met by the content raises clicks while attracting the wrong audience.
- Use titles and descriptions that match query intent.
- Describe the benefit or information concretely rather than vaguely.
- Keep product, price, stock and campaign information current.
- Evaluate the mobile result view and the landing page together.
- Show a date only for a genuine update.
- Use structured data that is consistent with visible content and of a supported type.
A fixed title character count, or adding the year to every heading, is not a rule for success. The search result view, the device and Google's own title generation can vary. Google recommends clarity, uniqueness and alignment with the content. Title links documentation.
Structural approaches that improve CTR
The promise in the search result, the main heading of the landing page and its first paragraph must serve the same need. Someone looking for a product should not be sent to an unrelated campaign page, and someone looking for scope should not be sent to a contact form alone. A person arriving from an SI answer should also be able to find the relevant version of the compared product or the current policy easily.
High impressions with a low CTR in Search Console is a candidate for review; it does not automatically mean a bad title. Position, query mix, brand search, device and the features of the results page all matter.
Structured data has to match visible content and a supported content type; it does not guarantee a special appearance in search or a higher CTR. The social share title and image should reflect the page's real promise too, and social preview is not the same control surface as the Google search title. Google structured data policies.
Validating with A/B tests
Ad copy variants can be compared in a controlled experiment. Changing an SEO title and comparing the previous four weeks with the next four is not on its own a randomised A/B test. Position, season, competitors and query mix may have changed.
For SEO changes, evaluate suitable page groups, baseline data and confounding factors. Rather than large changes on one strong page, prefer edits tied to a real problem plus recorded monitoring.
What to do when CTR is high but conversion is low
First look at whether the traffic carries the right need, whether the page keeps the promise it made and whether the measurement is correct. Then examine price, trust, mobile usability, form and payment errors. The answer is not always a bigger CTA.
Conversion Analysis: the Diagnostic Layer of CRO
Conversion analysis investigates where users progress toward the goal, where they stop and which barriers they may hit. A funnel report can show where the problem is; understanding why requires usability observation, interviews, support records and technical review.
If abandonment rises at the payment page, a long form is not the only explanation. A late-appearing shipping fee, a payment error, delivery uncertainty, the wrong product variant or a missing record in measurement can produce the same picture. On SI-sourced visits there can also be a mismatch between prior information and the current offer on the page, and without seeing the external assistant's conversation that mismatch cannot be confirmed.
The four steps of conversion analysis
| Step | Work to do | Concrete output |
|---|---|---|
| Goal definition | Define the sale, qualified lead, activation or task completion with an eligible audience and time window | Success definition and a metric dictionary |
| Data collection | Review analytics, CRM, the order system, interviews, usability sessions and suitable agent tests | A dataset with known sources and limits |
| Barriers and opportunities | Separate abandonment, errors, missing information and expectation mismatch | A problem list with its evidence |
| Action plan | Tie each problem to a hypothesis, an owner, a method and a success criterion | A prioritised experiment and development list |
In a measurement audit, check specifically for the same order counted twice, a form click mistaken for a valid enquiry, test traffic mixed into production data and different denominators used across reports. SI can group feedback into themes, and those themes must be verified by a human against sample records.
What Does the CRO Process Consist Of?
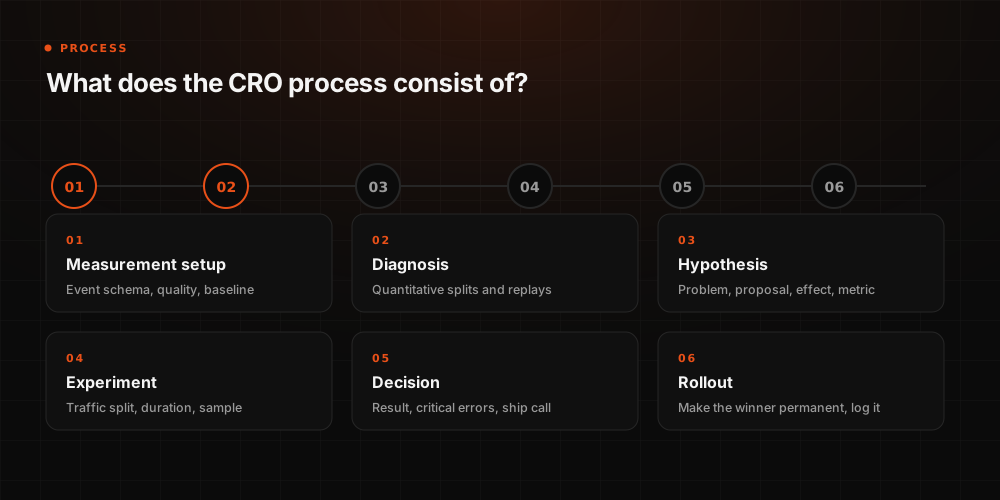
Analysis, ideas and hypotheses
A good hypothesis links a design choice to an observed problem. "Let's change the pricing table" is not a hypothesis on its own. A more usable form is:
Visitors on eligible product pages may be hesitating before payment because they learn the total delivery cost too late. Making delivery terms visible during product selection may increase verified orders per eligible user. There must be no unacceptable deterioration in returns, margin or page performance.
That hypothesis has to be supported by a real user finding or a support record. SI saying it works well on similar sites is not evidence of effect for a specific client.
Prioritisation
Priority is set by weighing the evidence for the problem, the number of users affected, the economic value, the development effort and the possible harm. Scoring frameworks such as ICE, PIE or PXL can structure the discussion; the scores are not real probabilities of success and do not remove team judgement.
Obvious faults such as a broken payment integration, an inaccessible form or a wrong price get fixed first. There is no need to serve the broken version to a share of users just to produce an experiment. Ambiguous design or offer choices are the right experiment candidates.
A/B tests and experiment design
An A/B test estimates the effect of a change by randomly assigning eligible units to control and variant conditions. The unit can be a user, an account or another suitable cluster. Repeat visits from the same person must not be treated as independent new people.
Illustrative experiment card: clarity of delivery information
| Field | Example definition |
|---|---|
| Problem | On eligible products, delivery terms are not visible enough at the moment of decision |
| Control | The current product page |
| Variant | Same product and price; delivery scope and fee calculation shown earlier |
| Assignment | Predefined eligible users; persistent, random assignment at user level |
| Primary metric | Verified orders per assigned eligible user within a defined follow-up window |
| Guardrail metrics | Net revenue per user, returns and cancellations, errors, performance and support load |
| Subgroups | Predefined device groups and detectable SI referral groups, where data allows |
| Decision rule | Sample size planned from baseline data, analysis method, stopping rule and a business value threshold |
Selecting "only users who reached the payment page" after seeing the variant can hide the effect of the change on reaching that stage. The analysis population and exclusion rules must not be changed after results are seen in order to manufacture a winner.
Analysis, learning and scaling
When an experiment ends, the uplift percentage is not the only thing reported. Data quality, effect size, uncertainty, business value and guardrail metrics are read together. The result can be positive, negative or too uncertain to decide on. Without a proper equivalence design, "no significant difference found" does not mean "the two versions are the same".
The change is rolled out in a controlled way. The owner, the rollback condition and the monitoring period are recorded. When the model, product, traffic or price changes, the validity of an earlier experiment is reassessed. Hypothesis, versions, result and decision are kept in an experiment archive.
A/B Tests, Personalisation and Advanced Experiment Methods
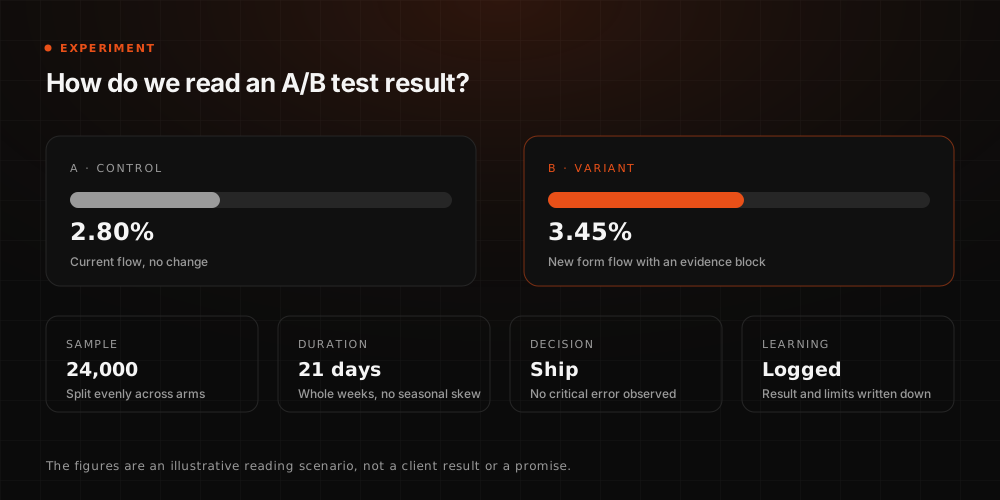
Which experiment method should be used when?
| Method | Purpose | What to watch |
|---|---|---|
| Fixed-horizon A/B test | Compare two conditions with a predefined sample and analysis plan | Checking a standard p-value every day and stopping at the first threshold raises the risk of a wrong decision |
| Sequential testing | Run interim evaluations planned with a suitable method | Requires statistics designed for repeated looks; not the same as peeking at an ordinary test |
| Bayesian analysis | Evaluate the effect distribution and decision risk under data and priors | Priors, decision thresholds, loss and stopping policy all shape the outcome |
| Multivariate testing | Investigate the effect of several components and their interactions | Variant count and sample requirements grow quickly |
| Multi-armed bandit | Send more traffic to options that look good while still learning | Needs suitable analysis for delayed conversions, changing conditions and the comparison goal |
| CUPED | Reduce estimate uncertainty using suitable pre-experiment data | Depends on the relationship between historical data and the target; it does not halve every test |
| Personalisation experiment | Measure the contribution of a policy or recommender for eligible users | Control group, data use and possible harm across segments must be assessed |
Frequentist methods cover sequential designs too. Choosing a Bayesian method does not by itself make early stopping error-free. These distinctions should be understood before a tool is selected. GrowthBook statistics overview, sequential testing documentation.
The benefit of CUPED depends on how strongly pre-experiment variables correlate with the outcome. The original research showed different gains on different metrics, which is why a single improvement ratio cannot be carried across businesses. CUPED research.
How are sample size, MDE and test duration set?
Planning needs the baseline rate, the smallest effect worth detecting, error tolerance, statistical power, the assignment unit and the conversion delay. MDE is the smallest effect the design aims to detect under given conditions; it is not the effect the change will actually produce.
There is no universal rule such as "two weeks is enough" or "you need 1,000 conversions a month". At low volume, fewer variants, larger and more meaningful changes, a suitable observation window and qualitative research may take priority. A B2B sales cycle, or the time it takes for returns to appear, can require longer follow-up.
Does a 20% uplift always mean a winner?
An illustrative fixed-horizon experiment on independent users:
| Group | Users | Converting users | Conversion rate |
|---|---|---|---|
| Control | 10,000 | 200 | 2.00% |
| Variant | 10,000 | 240 | 2.40% |
The observed difference is +0.40 percentage points, a 20% relative increase. For independent Bernoulli observations, a simple normal approximation puts the roughly 95% confidence interval for the difference between −0.01 and +0.81 percentage points. Because the interval includes zero, a "20% uplift" headline alone does not support a strong winner decision.
This calculation is a teaching example. In a real experiment the assignment unit, dependent observations, multiple comparisons and the chosen analysis method all matter. Business significance is assessed separately from statistical uncertainty.
How is experiment data reliability checked?
An unexplained deviation from the expected assignment ratio, known as sample ratio mismatch (SRM), can indicate a problem in assignment or data processing. An experiment result should not be explained before assignment, exposure, logging and filtering steps have been investigated. A change in the human/bot filter can also affect groups differently. Microsoft Research on SRM.
In an experiment that changes an SI assistant, the model, system instructions, knowledge source and tool versions must be recorded. Otherwise it is unclear which change was measured. The success rate of synthetic task tests and the commercial effect on real customers are reported separately.
How Is the Conversion Rate Increased?
Website optimisation tips
The page must make clear who the benefit is for, what the product covers, what conditions apply to the price and what the next step is. Mobile usability, page performance, accessibility, site search, product variants and error-recovery flows should be examined with real tasks.
A title or description produced by SI goes through the same accuracy check. A wrong feature, a certificate you do not hold or an outdated delivery promise is not fixed by writing it more persuasively. Keeping product and policy information current is part of conversion work.
Improving user experience and using effective calls to action
A CTA should explain which step the user is taking and what happens next. "Continue" can be enough in some flows; where a decision is required, "See delivery options", "Pick a demo time" or "Confirm the order" is clearer. The right wording follows the real flow.
Forcing a long sales form on someone who wants to see the price, or treating an information download button as a meeting request, creates expectation mismatch. Necessary consent, payment confirmation and security steps stay in place while unnecessary work is removed. Rather than reducing reading behaviour to a single F-shaped pattern for everyone, use clear headings, meaningful grouping and usability tests. NN/g research on reading patterns.
Checkout, forms and onboarding
Form fields need visible, programmatically associated labels, and requirements, example formats and errors have to be explained. Valid input must not be lost after an error. The success message after submission must reflect what was actually recorded on the server.
At checkout, total cost, delivery and return terms should be accessible before the decision. A retry must not create the same order twice. In onboarding the goal is not to reduce the number of screens but to help the user reach the first meaningful value in the product. If sign-ups rise while activation falls, the process has to be reviewed as a whole.
Traffic quality and micro conversions
The right audience landing on the wrong page is also a lost conversion. Campaign, query, content and offer have to meet on the same need. Micro conversions such as opening a comparison, starting a trial or checking pricing help you understand the journey; they should not be declared a success in place of a qualified customer or a real sale.
SI referrals can be reviewed separately, but a high rate on a small group may not be enough to change the whole site strategy. Volume, quality and economic value are read together.
Cross-device journeys
A person can research on mobile and buy on a computer, or evaluate options in an SI assistant and later visit the brand directly. Do not assume every step can be linked to the same user. The observable data, permissions and identity scope have to be explained in the report.
Browser storage limits can affect the persistence of experiment assignment. Using localStorage is not a general way around tracking protections; browser and version conditions have to be examined separately. WebKit on storage and ITP.
CRO for Agentic Commerce and Agent Experience
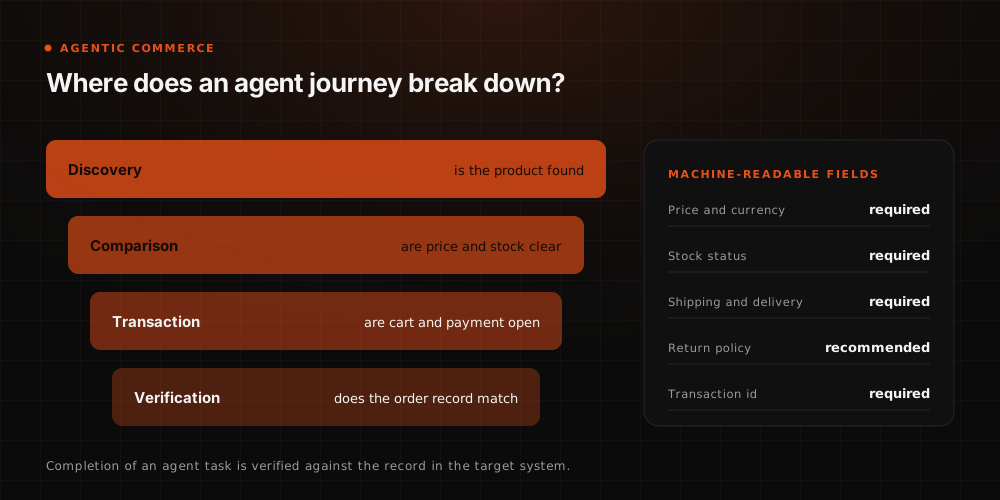
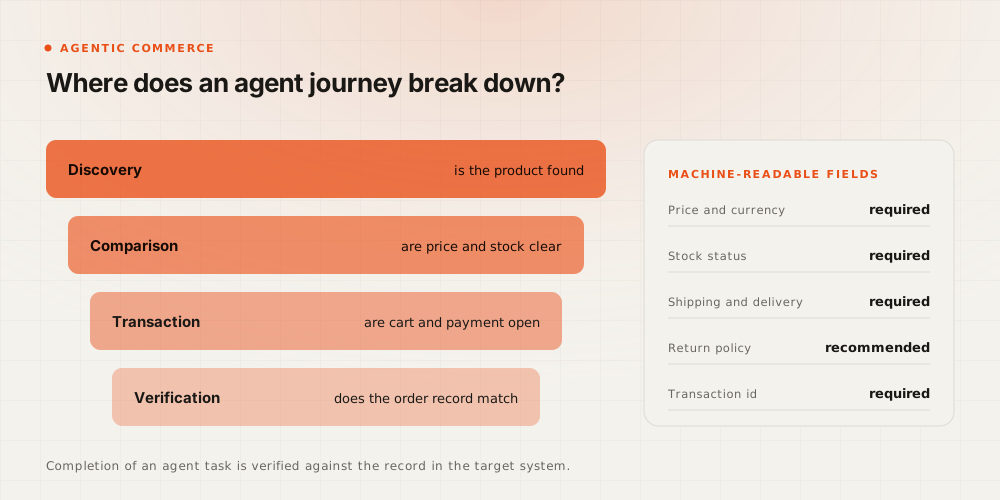
A human directed by an SI assistant and an agent acting with the user's authority are two different experiences. The human evaluates the page and decides; the agent may carry out a task through a browser interface or a suitable integration. In both cases CRO examines whether the correct outcome is completed reliably.
Do not assume browser agents only read JSON or cannot use JavaScript. They can interact through screenshots, the DOM and the accessibility tree. Semantic HTML, descriptive form labels and stable actions make a site easier to use for agents as well as for people. Google web.dev: sites agents can use.
Which tasks should be tested for browser agents?
- Finding whether the product or service fits the need.
- Determining the correct variant, eligibility condition and total price.
- Filling the form correctly and continuing after an error.
- Handing over to the right person when consent or payment confirmation is required.
- Verifying that the transaction was actually completed.
Tasks should be repeated with a defined browser, language, account state and agent version. The success criterion must not be simply reaching the final screen. For a booking, check that it was recorded with the correct date and party size. Rather than blindly removing CAPTCHA or security checks, design appropriate access and verification.
What does conversion mean in API-based agent commerce?
A successful API response does not always mean the sale completed. Product, price, tax, delivery, authorisation, payment and order status all have to corroborate one another. Repeated requests must be handled safely with the same transaction identifier, and cancellation, refund, error and human-handover scenarios have to be considered.
Protocols such as UCP define technical contracts for operations like checkout. Protocol support does not automatically grant acceptance to a specific platform's commerce program or availability in every country. Integration and program conditions are checked separately. UCP checkout REST specification, Google's UCP integration interest form.
Setting up a protocol integration is not the first job for every site. If product data, transaction accuracy and the channel the customer actually uses are not ready, those come first. Being visible to agents is not the same capability as completing an authorised, error-free transaction.
How is agent task success rate calculated?
Illustrative example: out of 100 valid tasks whose outcome window has closed, 80 are completed correctly by the agent, 10 are resolved after handover to a human and 10 are not resolved.
- Autonomous task success rate: 80 / 100 = 80%.
- Total resolution rate including handover: 90 / 100 = 90%.
- Unresolved task rate: 10 / 100 = 10%.
Handing over to a human can be the correct behaviour where authorisation or security requires it. Reducing handovers should therefore not be a success target on its own. Tasks that have not concluded must be shown separately and not counted as successful. Three technical retries of the same task do not create three customers or three conversions.
These metrics are not added to the human session conversion rate. Synthetic task tests, real customer tasks and test orders are kept apart.
How is a brand's own SI assistant optimised?
First a representative set of tasks and questions is prepared. Accuracy, product knowledge, tool use, authorisation limits, human handover and the real transaction outcome are evaluated. Business impact can then be measured with an online experiment at user or account level.
Answer quality, latency and cost are important intermediate measures. The assistant saying "your transaction is complete" is not success if no order or record was created in the back office. A model's assessment of its own output does not replace independent checking.
Which Metrics Does CRO Aim to Improve?
The primary target of a CRO program is chosen from the real business outcome. Not every metric has to rise at once; some are monitored as guardrails.
| Metric | How to read it | What to check alongside |
|---|---|---|
| User/session conversion rate | Share of eligible units completing the defined goal | Denominator, conversion window, data quality |
| Qualified enquiry rate | Share of eligible enquiries within the defined audience | CRM acceptance, progress to opportunity and sale |
| Revenue per user | Net revenue in the same scope divided by eligible users | Returns, discounts, cancellations and margin |
| Average order value | Revenue divided by order count | Order volume and contribution margin |
| CPA | Defined acquisition spend divided by conversions in the same scope | Which conversion is counted and the attribution window |
| CAC | Defined customer acquisition cost divided by new customers | Cost scope, customer quality and payback period |
| Form/checkout completion | Completions divided by starts of the same flow | Definition of a start and the real business outcome that follows |
| Agent task success | Share of valid tasks completed correctly | Authorisation, retries, human handover, real outcome |
| Latency and errors | Waiting and failure for a user or a task | Device, channel, model and tool version |
| Returns, complaints, support load | Cost and harm the change creates later | Sufficient follow-up time and sample |
What is the relationship between conversion rate and cost per click?
A rising conversion rate does not automatically lower CPC. CPC is cost per ad click; CPA is cost per selected conversion. Using the same click and conversion scope:
CPA = CPC ÷ conversion rate — the rate is used in decimal form.
Illustratively, at a CPC of 20 and a click-to-conversion rate of 2%, CPA is 20 ÷ 0.02 = 1,000. If CPC stays the same while the rate rises to 4%, CPA becomes 500. In this example the metric that falls is CPA, not CPC.
This relationship must not be applied across different attribution windows or different conversion definitions. ROAS expresses revenue against ad spend, which is not the same as a profit-based return on investment. More conversions can also mean lower profitability through heavy discounting or returns.
Conversion Rate Optimization Tools
Tool selection should start from the need rather than a list of names: seeing where the loss happens, researching why, implementing the change, evaluating the experiment and verifying the real business outcome are different capabilities.
Using Google Analytics: GA4 and the SI Assistant channel
In GA4, important user actions can be defined as key events. Do not confuse the user or session rate for a selected event with the rate for "any key event". The conversion context used for ad optimisation is evaluated separately. GA4 key events, GA4 metric definitions.
As of 9 September 2026, Google's default channel definitions include an SI Assistant channel. So it is wrong to say a custom channel always has to be built from scratch for SI referrals. In Google's documentation, traffic from AI Overviews and AI Mode is counted within Organic Search. GA4 default channel group.
That classification does not make all SI impact visible. Referrer information can be lost, and a later direct visit or a device switch can hide the path. Rather than assigning unknown traffic to SI by assumption, state the measurable scope and the missing visibility. The real outcome then has to be verified against CRM and order records.
Heatmaps and user behaviour analysis
Heatmaps help you see aggregate behaviour such as clicks and scrolling, and suitable session recordings help you examine difficulty in a flow. They are not eye tracking, and they are not proof of intent or causality on their own. Tools such as Microsoft Clarity sit in this research layer. Clarity heatmaps overview.
Sensitive fields must be masked in recordings, and access and retention scope defined. Usability interviews plus support and sales feedback add context to analytics data. If SI is used for classification, data sharing and sample accuracy have to be reviewed separately.
Experiment and release management tools
Depending on the need, evaluate client- or server-side assignment, feature flags, metric definitions, sequential analysis, warehouse connectivity and rollback support. Using a feature flag does not by itself remove the risk of conflicts and errors.
Because Google Optimize shut down on 30 September 2023, a new program cannot be built on that tool. Current product choice should follow team capability, existing architecture and total cost of operation. Google Optimize status.
SI and agent analytics
For SI-sourced human visits, review source and channel, landing page, qualified conversion and revenue together. For agent transactions you need a task identifier, transaction status, errors, retries, human handover and a verified outcome. For owned SI assistants, model, knowledge source and tool versions are recorded as well.
A user-agent string alone is not reliable proof of identity or authorisation. Crawl requests, synthetic tests and real transaction tasks have to be separated by purpose. Duplicates in transaction data must be cleaned, and unnecessary personal data must not be collected for reporting.
Which questions should you ask when choosing tools?
- At which unit — user, account or task — can the experiment be assigned?
- Are assignment, exposure and outcome records linked to each other reliably?
- Can the primary metric be verified against the CRM or order system?
- Are the analysis method, sample size and stopping rules visible?
- How are data access, retention, masking and export managed?
- Does the team have the capability to implement and maintain it?
CRO Examples: From Hypothesis to Business Outcome
The examples below were created to explain method. They are not completed client cases or a promise of results.
| Scenario | Problem to investigate and the change | Primary outcome | Guardrail check |
|---|---|---|---|
| E-commerce | Total cost uncertainty; improve delivery and fee clarity on eligible products | Verified orders or net revenue per eligible user | Margin, returns, payment errors |
| B2B | Scope not understood before a demo request; explain use cases and fit | Qualified opportunities per eligible user or account | Lead quality, sales team time, sales cycle |
| SaaS | First valuable action not found after sign-up; task-based onboarding | Defined activation per new eligible user | Retention, support load, cancellation |
| SI referral | People arriving with comparison intent find no evidence; make current features and terms visible | Qualified conversion in the detectable eligible audience | Volume, segment uncertainty, overall experience |
| Authorised agent | Variant or delivery constraint misunderstood; clarify the interface and transaction contract | Valid tasks completed correctly | Wrong orders, unauthorised transactions, handover |
If a real case is published, state the date range, baseline rate, denominator, the change, the comparison method, the uncertainty and the commercial outcome. A rise in organic traffic alone should not be labelled a CRO success.
How Is CRO Applied in the First 90 Days?
This calendar is a plan of work, not a guarantee of a given uplift in 90 days or a completed experiment every month. It has to be adapted to data volume and the business cycle.
| Period | Focus | Expected output |
|---|---|---|
| Days 1–15 | Goal, data and the current journey | Metric dictionary, measurement faults, baseline report, human/agent separation |
| Days 16–30 | User research and problem selection | Prioritised problems with evidence, hypotheses and an experiment plan |
| Days 31–60 | Suitable change and evaluation | A controlled experiment, usability test or technical task test, depending on data volume |
| Days 61–90 | Result, rollout and learning | Result report with uncertainty, rollout or rollback decision, next work list |
SI support can be used from day one for research summarisation or hypothesis drafting. An agentic commerce integration should be planned once the channel need, data and transaction infrastructure are genuinely ready. Not every business has to build every layer at once.
Frequently Asked Questions About Conversion Rate and CRO
What is an ideal conversion rate?
There is no universal ideal. A sale, a demo, a newsletter sign-up and an activation are not equally difficult goals. Channel, intent, product price, country, device, new versus returning users and the denominator definition all change the result. Compare against your own data under similar conditions first, and if you use an external benchmark, check its source, date and measurement definition.
Which factors affect the conversion rate?
Traffic quality, the offer, price, product fit, trust, content clarity, performance, usability, and form and payment reliability are the main factors. In the SI era, the currency of source information, the expectation a person carries in, and the ability of authorised agents to complete tasks are added to the assessment.
What is a good CTR?
The same CTR target cannot be used for organic results, search ads, display ads and email. Position, query, brand recognition, device and ad format all matter. Evaluate CTR together with conversion quality inside your own comparable groups.
How long does it take to see results?
A measurement or technical fault can be found quickly; measuring the reliable commercial effect of a change takes longer. Traffic, baseline rate, effect size, sales cycle and analysis method set the timeline. A fixed promise such as "a definite winner in two weeks" should not be made.
Do we have to redesign every page?
No. High-value user tasks and evidenced problems come first. Content clarity, a single error or a form flow can be a higher priority. In a large redesign, several factors change at once, which makes cause and effect harder to read.
Can CRO work with our existing marketing stack?
Most programs can start from the existing CMS, analytics, CRM and order system. Data quality, assignment, integration and access capabilities do have to be checked. Buying a new tool does not fix a wrong conversion definition or missing order data on its own.
Can CRO be done with low traffic?
Yes. User interviews, usability testing, accessibility, measurement and technical fixes are all possible. Little data makes a reliable A/B decision on small effects difficult. Substituting a micro conversion for the real business goal, simply because it produces more data, is not a solution.
Does SI-assisted CRO fully replace classic CRO?
Research, correct measurement, user need and experiment logic keep their importance. SI speeds some work up and adds new experiences such as agent tasks. SI output does not automatically remove the need for human verification, real user research or business outcome measurement.
Does traffic from SI always convert more?
No. Source, query intent, page, product and sample all differ. A high rate in your own data can be a useful finding; it does not prove that the same people arriving from another channel would buy more via an SI referral.
Does SI visibility without a click count as a conversion?
A brand appearing in an SI answer is a visibility indicator. A sale, a qualified enquiry or another defined business outcome has to be verified separately. An authorised transaction completed without a site visit can be a real conversion; it should not be equated with a mention.
Is a special SI schema required for agent-friendly pages?
Google Search does not require a special schema or a separate SI text file for its SI features. That statement concerns Google's search features; a specific commerce integration may have its own technical requirements. Visible, accurate content and meaningful structure are the foundation. Google AI optimization guide.
Related Guides and the Next Step
To take conversion work further alongside measurement and task design, see SI & Agentic Analytics, SI-based A/B testing and Agentic Commerce Readiness.
For your own program, choose one goal, verify the data you already have and document the clearest decision barrier. Build your first hypothesis from that evidence.
Let's review your CRO roadmap.
Go through your current measurement, your priority conversion problems and the experiences you want to improve in the SI era, together with our team.