

Market and industry analysis is the discipline that underpins both a company's own growth strategy and the value it offers its customers. Done well, it shows where to invest, which service will find demand, where competitors are weak and how much market share a brand can realistically take. Done badly, it produces the most expensive outcomes there are: years of investment in a product nobody wants, growth chased in a link of the value chain where there is no profit, or a position defended long after the competition abandoned it.
The 2025 to 2026 period is a breaking point for this discipline. Search behaviour is shifting to SI. OpenAI announced in October 2025 that ChatGPT had reached 800 million weekly active users; in February 2026 that figure was updated to 900 million. According to Similarweb, 58.5 percent of Google searches in the United States end without a click. Seer Interactive, studying 25 million organic impressions, measured organic click-through rate falling from 1.76 percent to 0.61 percent on queries where an AI Overview appears. Independent industry research found that 80 percent of consumers rely on SI answers for at least 40 percent of their searches, and that organic web traffic has fallen 15 to 25 percent in many sectors.
What this tells us is simple: being visible no longer means ranking on Google, it means being cited inside SI answers. A modern market analysis therefore has to cover SI visibility alongside traditional demand measurement. This guide combines the classic frameworks with that new reality in a single methodology.
At Webtures we have run market analyses for hundreds of brands from Istanbul and London over sixteen years, and we read the service market we operate in with the same discipline every year. The approach in this guide is a synthesis of that experience and the measurement logic we built into our GEO and AEO platform.
Foundations: Seven Building Blocks and Two Disciplines
Market analysis or competitive intelligence?
The two terms are frequently confused. Competitive intelligence focuses on rivals' tactical moves: new hires, price changes, product launches, campaigns. Industry analysis is about understanding the structural forces that determine a market's profitability, how the sector is evolving and its long-term economics.
Both are necessary and neither substitutes for the other. A company that watches only its competitors without understanding structural dynamics ends up copying their mistakes and falls into the trap of unprofitable growth. In digital marketing, the most common form of that trap is producing content for every keyword a competitor ranks for, without ever asking whether those keywords sit in a market where conversion actually happens.
The seven building blocks
The structure used by global management consultancies consists of seven interconnected blocks. The sections of this guide follow the same order:
- Market definition: drawing the scope and boundaries of the market to be analysed.
- Market size: quantifying the total opportunity.
- Customer segmentation: splitting the market into subsets and identifying where needs diverge.
- Competitive landscape: mapping rivals and finding where value is captured.
- Customer decision journey: examining the buying process from awareness to loyalty.
- Growth drivers, trends and risks: the macro and micro dynamics that will shape the market's future.
- Strategic implications: synthesising every finding through the question "so what does this mean for us?"
The seventh block is the one most often skipped. If an analysis report ends with labels such as "competition is high, buyer power is moderate", it is not an analysis but a status report. Every framework in this guide is described with the principle that findings must resolve into a decision.
The framework chain
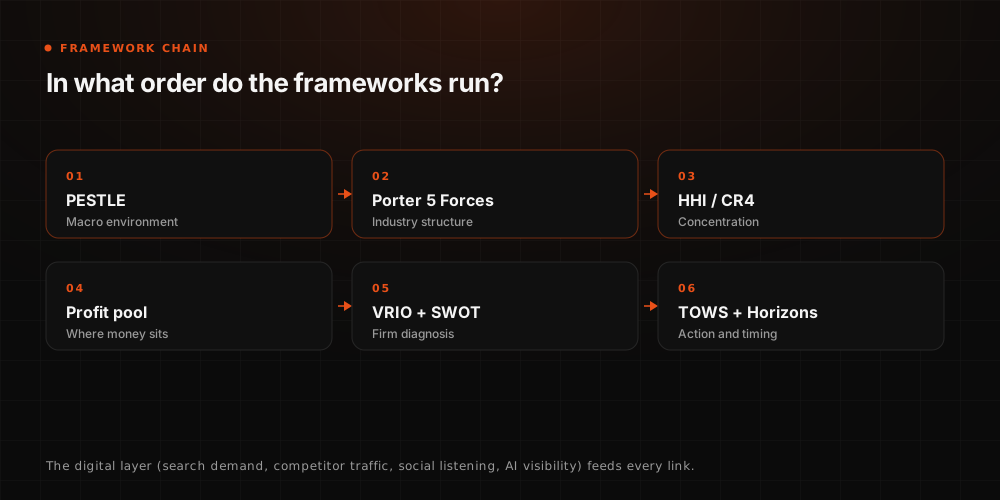
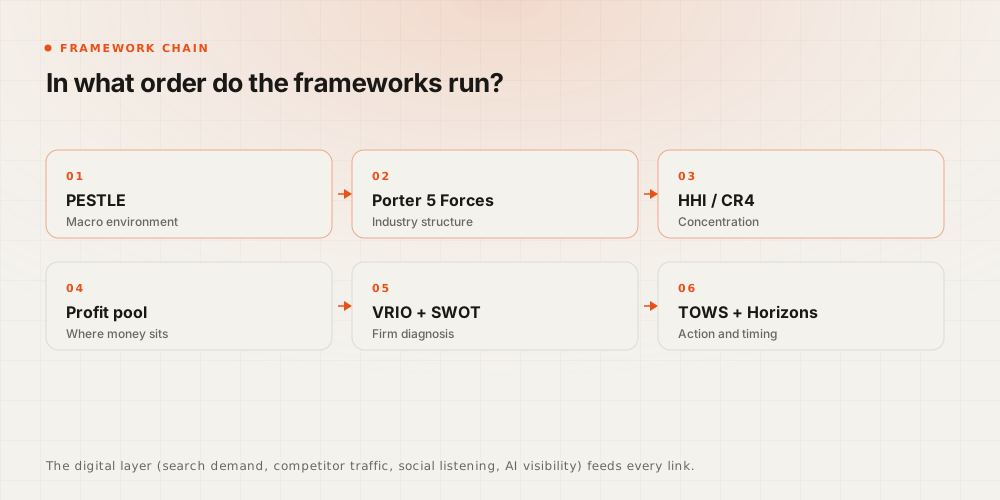
Frameworks work as a chain, not individually. The sequence we recommend in practice is:
PESTLE (macro environment) to Porter's Five Forces (industry structure) to HHI and CR4 (numerical confirmation of concentration) to profit pools (where the money is made) to strategic group map (where competitors sit) to SWOT (firm diagnosis, taking its external view from the earlier steps) to VRIO (testing which strength is a durable advantage) to TOWS (turning findings into action) to Three Horizons (spreading those actions over time).
The digital layer, meaning search demand, competitor traffic analysis, social listening and SI visibility, feeds every link in that chain with data.
Defining the Market: the Relevant Market Fallacy
Every analysis starts with a market definition, and the biggest mistakes are made right here. "The healthcare sector" is not a market; "medical devices for minimally invasive cardiac procedures" is a market. "Digital marketing" is not a market; "performance and SEO services for e-commerce brands in Turkey with an annual digital budget above five million lira" is a market.
When market boundaries move, everything moves with them: each of Porter's five forces, market size, the competitor list and the concentration metrics. This is the problem known in the literature as the relevant market fallacy. Define the market too narrowly and every firm looks like a monopoly, with HHI misleadingly high; define it too broadly and you cannot see your real competitors.
Practical note: define the market on two axes. The first is the product or service axis: which job does it solve, what are the substitutes. The second is the geographic and segment axis: which region, which customer size. The Jobs-to-be-Done approach in the customer section is the most robust way to define the product axis by the job the customer is trying to get done rather than by the product name. As the milkshake case shows, the market may not be "the milkshake market" but "the market for making the morning commute bearable".
Sizing the Market: TAM, SAM and SOM
Three layers
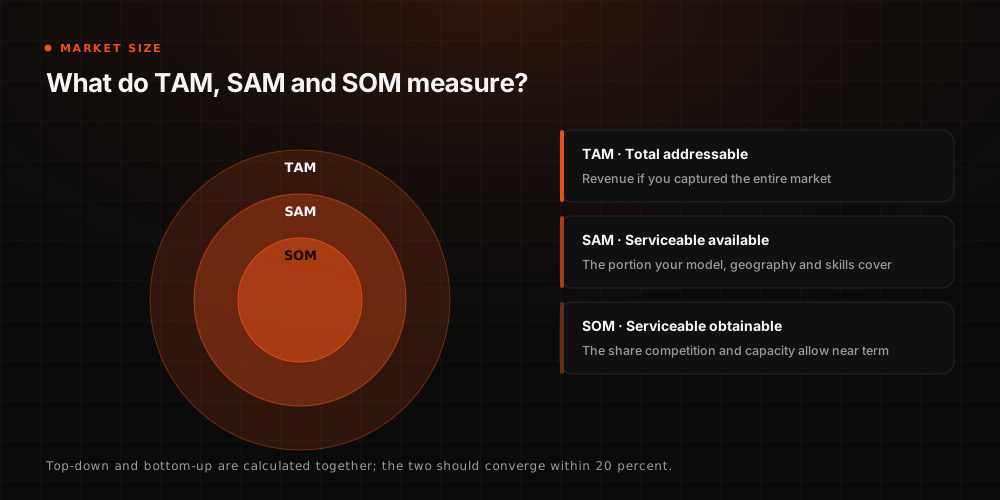
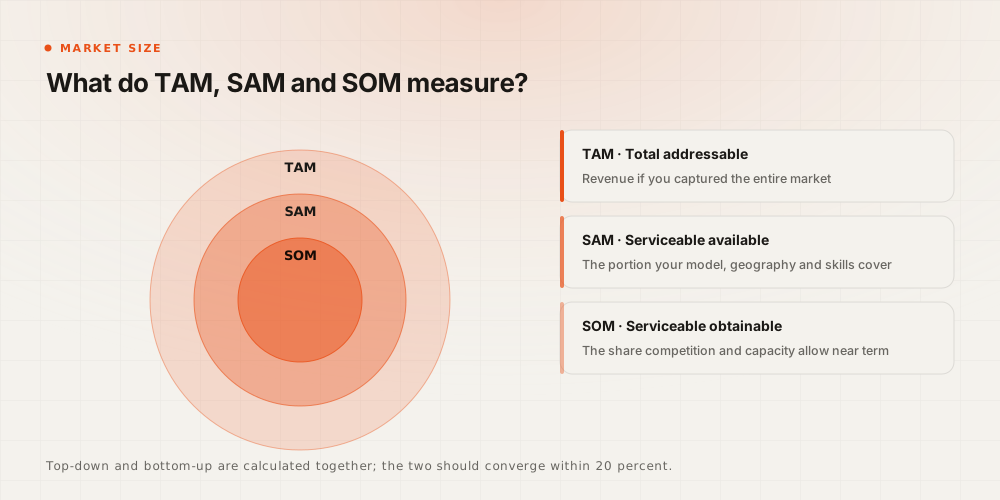
- TAM, total addressable market: the theoretical revenue potential if you captured 100 percent of the market.
- SAM, serviceable available market: the portion you can genuinely address given your business model, geography and service capability.
- SOM, serviceable obtainable market: the share you can realistically win in the short term given competition, capacity and resources.
The most common mistake in investor decks is presenting SOM as if it were TAM. The second is mixing units: advertising spend and agency service revenue are not the same thing, nor are user counts and transaction volume.
Three calculation approaches
Top-down: start from macro statistics and industry reports, then narrow to the target segment. It is fast, easy to follow in an investor deck and shows the theoretical ceiling. Its weakness is over-optimism: the sentence "if we take just 10 percent of this market that is eight million dollars a year" proves nothing about how that 10 percent would operationally be won. Because most pitch-deck templates push founders toward this method, inflated TAM figures have become almost an industry habit.
Bottom-up: start from unit economics and field reality. Unit price multiplied by a realistic customer count gives SOM; from there you scale up to SAM for all customers of a similar profile and to TAM for the theoretical whole market. It takes more research but the results are conservative, realistic and directly compatible with sales capacity. In B2B markets, infrastructure projects and enterprise services it is by far the most reliable method.
A simple example: a mobile accounting application priced at 100 dollars a year, able to reach 500,000 small businesses through its sales channels, has a SOM of 50 million dollars; with two million businesses of a similar profile, a SAM of 200 million dollars; and with ten million target businesses worldwide, a TAM of one billion dollars.
Value capture: calculate the total financial value the product creates in the customer's operation, meaning savings and additional revenue, then determine what percentage of that value can feasibly be captured through pricing. This matters for SaaS products promising cost reduction and for enterprise solutions that raise productivity. Its weakness is the difficulty of measuring indirect or intangible value in money terms.
| Approach | Mechanism | Advantage | Risk | Ideal use |
|---|---|---|---|---|
| Top-down | Deriving a target share percentage from broad market data | Fast, simple, shows the macro ceiling | Over-optimism, detachment from operational reality | B2C, vision decks |
| Bottom-up | Unit price multiplied by reachable customer count | Realistic, compatible with sales capacity | Requires intensive research | B2B, enterprise services, infrastructure |
| Value capture | The priceable share of value created in the customer | Ties ROI directly to market size | Intangible value is hard to measure | SaaS, disruptive innovation |
Triangulation: testing one method against the other
Top-down usually inflates, because analysts include revenue from adjacent segments you will never reach. Bottom-up usually underestimates, because channels, cross-sell and price increases get forgotten. That is why you do both. The two results converging within roughly 20 percent is the strongest sign that you genuinely understand the market. If they do not converge, one of your assumptions is wrong, and that may be the single most valuable finding in the report.
Understanding the Customer: Segmentation, Personas and Jobs-to-be-Done
The limits of demographics
Demographic segmentation, age, gender, income, location, describes who the customer is but not why they buy. Two people with identical demographics can buy for entirely different reasons, and two people with nothing demographically in common can buy for exactly the same reason. Behavioural and needs-based segmentation carries more signal than demographic segmentation, particularly in B2B.
The milkshake case
The classic illustration is Clayton Christensen's milkshake study. A fast-food chain wanted to increase milkshake sales and ran the obvious research: it asked milkshake buyers what they wanted, changed the flavour and the thickness accordingly, and sales did not move.
The turning point came when researchers stopped asking about the product and started observing behaviour. Nearly half of milkshakes were sold before nine in the morning, to lone drivers who took them away and drank them in the car. The job those customers were hiring the milkshake for was not "drink something sweet" but "make my long, dull commute bearable and keep me from being hungry until lunch". Against that job, the competition was not other milkshakes but bananas, doughnuts and coffee.
The lesson is not about milkshakes. It is that a market defined by product category hides the real competitive set, and that the job the customer is trying to get done reveals both the true competition and the direction for improvement.
The three dimensions of a job
A job has three dimensions and a serious offer addresses all three:
- Functional: the concrete task to be completed. Reduce customer acquisition cost, enter a new market, close the monthly books.
- Emotional: how the person wants to feel. Confident in a decision, in control, unexposed to risk.
- Social: how they want to be seen by others. Competent in front of the board, forward-looking in front of the team.
In B2B, the emotional and social dimensions are consistently underrated. A buyer choosing a supplier is also choosing how a failure would look to their own management. That is why evidence, references and clear scope boundaries convert better than a lower price.
Using personas and JTBD together
Personas describe who the customer is; Jobs-to-be-Done describes what they are trying to accomplish. Used alone, personas drift into fiction, a stock photo with an invented biography. Used together they work: the persona carries the context, access and constraints, while the job carries the motive and the success criterion.
A workable format states the job, the situation that triggers it, the obstacles, the expected gain and how the customer measures success. If you cannot fill in the success criterion from customer evidence, you do not yet understand the job.
The job map
A job map breaks the job into the stages the customer passes through: define, locate, prepare, confirm, execute, monitor, modify, conclude. Marking where the pain is greatest at each stage shows exactly where a new offer can create value, and often that point is not the stage where your product currently operates.
Macro Environment: PESTLE Analysis
PESTLE examines six external forces the company cannot control but must anticipate: political, economic, social, technological, legal and environmental. Its purpose is not to produce a list but to identify which of those forces will genuinely change the economics of your market within the planning horizon.
| Force | What to examine | Question to answer |
|---|---|---|
| Political | Incentives, trade policy, public procurement, regulation of the sector | Which decision could change demand or cost overnight? |
| Economic | Growth, inflation, exchange rate, financing cost, consumer confidence | How does the customer's budget behave in this cycle? |
| Social | Demographics, work patterns, information-seeking habits, trust | How is the way the customer discovers and decides changing? |
| Technological | SI, automation, platform shifts, protocol standardisation | Which capability is becoming a commodity, which is becoming scarce? |
| Legal | Data protection, competition law, advertising rules, sector-specific law | What is the compliance cost and what is the penalty for missing it? |
| Environmental | Regulation, supply chain, reporting obligations, customer expectation | Does this force change cost, or only reputation, or both? |
The most useful discipline here is to force each item into one of three buckets: acts within twelve months, acts within one to three years, or watch only. A PESTLE where everything is "important" guides nothing.
Industry Structure: Porter's Five Forces
Porter's framework explains why some industries are structurally more profitable than others. It examines five forces: rivalry among existing competitors, the threat of new entrants, the threat of substitutes, buyer bargaining power and supplier bargaining power.
The framework is a profitability model, not a competitor list. Its output should be a statement about where profit is likely to accumulate and why, and which force your strategy must weaken or avoid.
Two common application errors
The first error is treating the analysis as a scoring exercise. Labelling each force high, medium or low and stopping there produces a diagram, not a decision. The question that matters is which specific force is eroding your margin today, and what would have to be true for that to change.
The second error is ignoring substitutes. In consulting and service markets the two substitutes that matter most are SI software and the customer simply doing the work in house. Both are getting cheaper and better. A market analysis that does not price those two options against your offer is incomplete.
Measuring Competitive Intensity: CR4 and HHI
Porter tells you the shape of the industry. Concentration metrics tell you how crowded it actually is, in numbers.
Concentration ratios, CR4 and CR8
CR4 is the combined market share of the four largest firms; CR8 the same for the eight largest. A CR4 below 40 percent generally indicates a fragmented, competitive market; above 60 percent indicates a market where a handful of players set the terms. The metric is easy to compute and easy to misread: it says nothing about how share is distributed among those four.
The Herfindahl-Hirschman Index
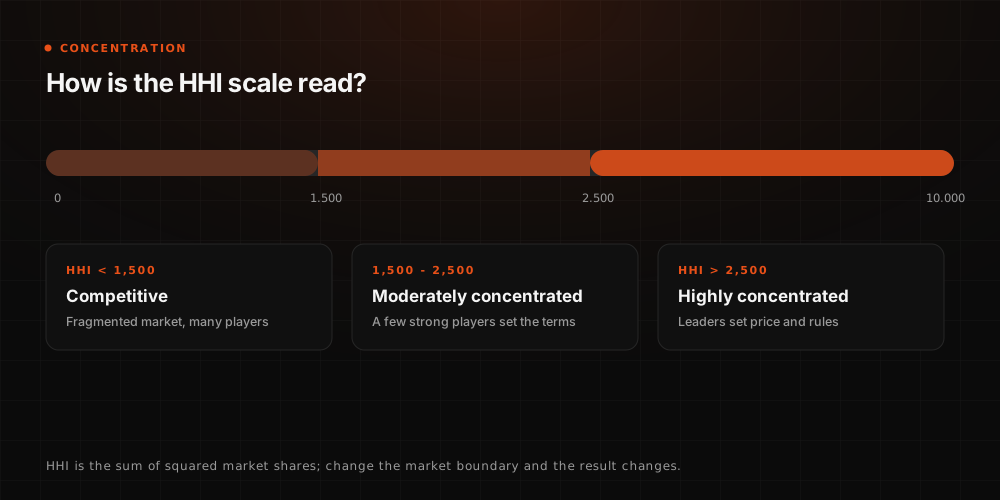
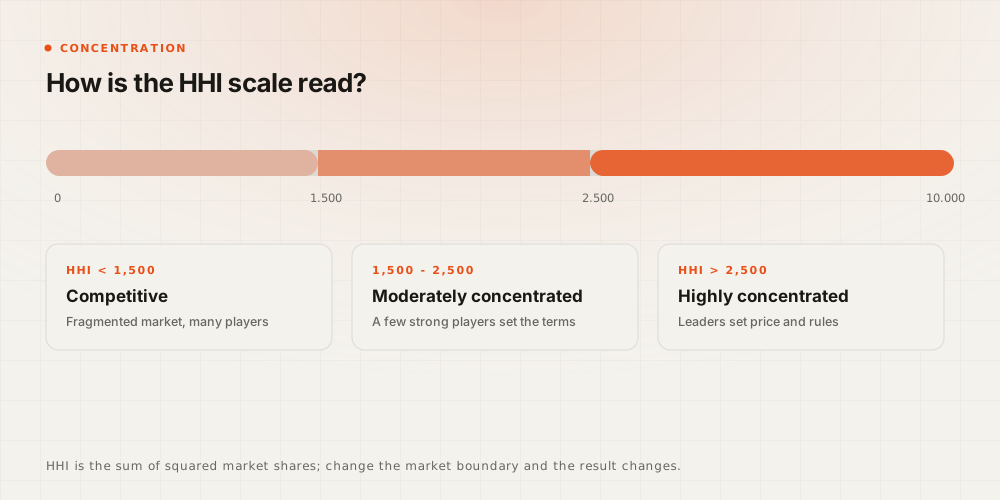
HHI is the sum of the squares of every firm's market share, expressed in percentage points. Squaring is what makes it useful: it weights large players far more heavily than small ones, so it distinguishes a market with four equal players from one where a single firm dominates.
| HHI | Reading | What it implies |
|---|---|---|
| Below 1,500 | Competitive | Fragmented market, many players, price pressure, low switching cost |
| 1,500 to 2,500 | Moderately concentrated | A few strong players set the terms; niches remain open |
| Above 2,500 | Highly concentrated | Leaders determine price and rules; entry needs a structural advantage |
A worked example: a market with four firms holding 30, 30, 20 and 20 percent gives 900 plus 900 plus 400 plus 400, an HHI of 2,600, highly concentrated. A market with ten firms at 10 percent each gives 100 times ten, an HHI of 1,000, competitive. Both markets have the same number of large players in the CR4 sense; only HHI separates them.
The critical caveat is the one from the market definition section: HHI is entirely a function of how you drew the market boundary. Report the boundary alongside the number, always.
HHI in digital marketing
The same logic applies to digital visibility. Instead of revenue share, use share of search impressions, share of clicks or, increasingly, share of citations in SI answers. A keyword cluster where one domain holds 60 percent of impressions behaves like a concentrated market: entering it costs more and takes longer than the keyword volume alone suggests. Running the concentration calculation on a keyword cluster before committing a content budget is one of the highest-return checks in the whole method.
Seeing Where the Money Is Actually Made: Profit Pools and the Value Chain
Revenue and profit do not sit in the same place. A value chain can move enormous revenue through a link that earns almost nothing, while a small adjacent link captures most of the margin. Profit pool analysis maps that distribution.
The classic illustration is automotive: manufacturing and dealership carry the revenue, while financing, insurance, parts and servicing carry a disproportionate share of the profit. The same asymmetry exists in digital marketing. Most advertising spend flows to the platforms; for a service business the real profit pool is not the media budget but strategy, measurement and implementation work.
A four-stage profit pool methodology
- Define the chain: list every activity from raw input to end customer, including the ones you do not perform.
- Size the revenue: estimate total revenue flowing through each link.
- Estimate the margin: estimate the operating margin of each link, using public filings, industry benchmarks and interviews.
- Draw the pool: plot revenue on the horizontal axis and margin on the vertical, so the area of each block shows absolute profit.
The decision that follows is usually one of three: move into a more profitable link, defend the link you hold by raising switching costs, or change the pricing model so you capture value where it is created rather than where the work happens.
Mapping Competitors: the Strategic Group Map
A strategic group map plots competitors on two axes that genuinely drive profitability in your market, revealing clusters of firms following similar strategies, and, more usefully, the empty spaces between them.
Five steps
- Choose two axes that actually separate firms, not two that merely describe them.
- Place every relevant competitor, including substitutes and in-house alternatives.
- Size each bubble by revenue or share so scale is visible.
- Draw the clusters and name the strategy each cluster represents.
- Examine the gaps: an empty space is either an opportunity or a place the market has already tested and rejected. Deciding which is the real work.
Example axes for a service market
Useful axis pairs for a marketing services market include breadth of service against depth of specialism, proprietary technology against pure human delivery, price level against evidence of outcome, and local focus against multi-market delivery. Combining two axes that are correlated, price and quality for instance, produces a diagonal line rather than a map and tells you nothing.
Digital Demand Analysis: Search Data and Share of Search
Everything above establishes structure. This is where the digital layer supplies live evidence.
Search demand and seasonality
Search volume is the closest thing to a real-time demand signal a market has. Read it in three ways: absolute volume, direction of travel over 24 to 36 months, and seasonality. A category whose volume is flat but whose commercial-intent queries are growing is healthier than one whose total volume grows on informational queries alone.
Two cautions. Tool volumes are estimates, and they diverge between vendors; use one source consistently rather than mixing. And in the SI era, falling search volume for a query does not necessarily mean falling demand, it may mean the question is now being answered inside an assistant.
Share of search
Share of search is a brand's proportion of total branded search volume in its category. It is a useful proxy for market share because it is measurable weekly, needs no panel data and, in several studies, leads market share by a number of quarters.
Calculate it as your branded query volume divided by the sum of branded query volume for every named competitor in the category. Track the trend rather than the absolute level; the absolute level is sensitive to which competitors you include.
Reading demand by service category
Break demand into intent tiers rather than one aggregate: informational queries that indicate a market forming, commercial-investigation queries that indicate active evaluation, and transactional queries that indicate immediate purchase. A market where informational volume is growing but commercial volume is flat is early, and pricing a service into it as if it were mature is the most common way to lose a year.
The Competitor's Digital Footprint: Traffic Estimation and Content Gap
Traffic estimation tools and their accuracy limits
Third-party traffic estimates come from clickstream panels, extrapolation models and partner data. They are directionally useful and individually unreliable. Treat them as a way to compare competitors against each other on the same methodology, never as a substitute for a company's own analytics.
Two disciplines make the numbers usable: always compare within one tool rather than across tools, and always look at the trend over at least twelve months rather than a single month's figure.
Backlink and advertising footprint
A competitor's link profile shows which publications, associations and partners treat them as a source. Their advertising footprint, visible through ad libraries and paid-keyword reports, shows where they are willing to spend money to buy attention, which is a strong signal about which segments they consider profitable.
Content gap analysis
A content gap analysis lists the queries where competitors are visible and you are not. Run correctly it produces three separate lists, not one: queries you should win and can win, queries you should win but cannot yet, and queries that are visible but commercially irrelevant. Producing content for the third list is the single most common waste in the discipline.
Prioritise the output by commercial intent and by the concentration calculation from earlier, not by volume alone.
Digital HHI and confirming the strategic group
Applying the HHI calculation to visibility share across a keyword cluster gives a numerical check on the strategic group map. If one domain holds a concentrated share of a cluster, that cluster belongs to a different strategic group from the one your map suggested, and the map needs revising.
Social Listening: Turning Conversation Into Data
Social listening captures what the market says when it is not being asked. Its value in market analysis is not sentiment scoring but three specific outputs.
The first is unprompted language: the words customers actually use for the problem, which almost never match the words the industry uses. That vocabulary belongs in your content, your product naming and your query targeting.
The second is the complaint set: recurring frustrations with existing solutions, which map directly onto the obstacles in the Jobs-to-be-Done framework and often reveal an unserved job.
The third is the alternatives set: what people say they use instead, which is the most honest substitute list you will find and frequently contradicts the competitor list in the strategic plan.
Two limits to state in any report. Social data over-represents the vocal and under-represents the satisfied, and sentiment classification remains unreliable for irony, sector jargon and Turkish-language nuance. Present it as directional evidence, never as a measured proportion of the customer base.
The New Layer: Visibility Analysis in the SI Search Era
What the data says
The numbers in the introduction are worth restating as an analytical premise rather than a headline. ChatGPT reached 800 million weekly active users in October 2025 and 900 million by February 2026. Similarweb measures 58.5 percent of United States Google searches ending without a click. Seer Interactive, across 25 million organic impressions, found organic click-through falling from 1.76 percent to 0.61 percent where an AI Overview appears. Independent industry research reports 80 percent of consumers relying on SI answers for at least 40 percent of their searches, with organic web traffic down 15 to 25 percent across many sectors.
Read together, these describe a structural change in where discovery happens, not a temporary dip in a channel. A market analysis that measures only search volume and organic ranking is now measuring a shrinking portion of the demand it claims to describe.
Share of Model: the new market share metric
Share of search asks what proportion of branded queries belong to you. Share of model asks a harder question: across a fixed set of buying questions, in what proportion of SI answers does your brand appear, and in what proportion is it cited as a source?
Measuring it requires three disciplines. First, a fixed question set, written once and not changed between measurement periods, or the trend is meaningless. Second, separate counting of mention and citation, because being named and being linked as a source are different commercial events. Third, an explicit statement of sampling limits: answers vary between sessions, models and regions, so a single run is an observation, not a measurement.
Tool categories
The tooling divides into three groups. Sampling platforms run a question set against several models on a schedule and report mention and citation rates. Log-level tools measure which SI crawlers and fetchers actually reach your pages and what they receive. Analytics platforms measure what happens after an SI-referred visitor arrives. All three are necessary; none of them alone answers the commercial question.
The GEO market itself: a lesson in uncertainty
Estimates of the size of the GEO services market vary by a factor of three between research houses for the same year. That divergence is itself the finding: the category is too young for its boundaries to be agreed, which is exactly the relevant market fallacy in live action. Use these figures as direction, never as a planning input.
Integrating SI visibility into the analysis
Practically, the SI layer attaches to the existing chain at three points. It adds a substitute to Porter's five forces, because an SI answer that resolves the customer's question without a visit substitutes for your content. It adds an axis to the strategic group map, because brands cited by models occupy a different position from brands that are not. And it adds a demand measure alongside search volume, because a category can be growing in assistants while flat in search.
Data Sources and Collection
Turkey sources
For the Turkish market the primary public sources are TÜİK for demographics and sector statistics, the Turkish Exporters Assembly for export volumes by sector and destination, the Central Bank for macro and exchange-rate series, the Trade Ministry for incentive programmes and e-export data, the Union of Chambers for company registry information and sector-level advertising investment reports for media spend.
Global sources
Internationally, the World Bank and OECD for macro series, Eurostat for European sector data, industry associations for category-level volumes, public company filings for margin and revenue-mix evidence, and paid research houses for category sizing. Read every paid market-size figure with its methodology note; the divergence between houses is frequently larger than the growth rate they report.
Primary research
Primary research is what separates an analysis from a literature review. Twelve to fifteen structured customer interviews, covering current customers, lost opportunities and target accounts, will surface the recurring problems that no secondary source contains. Ask about the last purchase decision, the problem at the time, the alternatives considered, the amount paid and who was involved. Look for past behaviour and concrete commitments rather than hypothetical intent.
Web scraping, APIs and automation
Automating collection is what makes an analysis repeatable rather than a one-off project. Prioritise official APIs over scraping; where scraping is the only route, respect terms of service and robots directives, rate-limit properly and store the raw response so a later question can be answered without re-collecting. Version the collection script alongside the data, because a change in the script is a change in the series.
Using SI for market research: speed and risk
Language models genuinely accelerate three tasks: summarising long documents, drafting interview guides and normalising messy competitor data into a comparable table. They are unreliable for three others: producing market-size figures, attributing statistics to sources and stating anything about a specific private company.
The working rule is simple. Every number that enters the report must trace to a named source with a date, and a model output is a draft of that trace, never the trace itself. An analysis that cannot show where a figure came from cannot be defended in the meeting where it matters.
From Analysis to Strategy: SWOT, VRIO, TOWS and Three Horizons
SWOT and VRIO
SWOT is the most used and least useful framework in the discipline, because it is usually filled in from opinion. Used properly it is a summary sheet, not an analysis: strengths and weaknesses come from internal evidence, opportunities and threats come from the PESTLE, Porter and profit-pool work already done.
VRIO is what turns a list of strengths into a strategy. It tests each strength on four criteria: is it Valuable, is it Rare, is it costly to Imitate, and is the Organisation set up to exploit it. A strength that is valuable but neither rare nor hard to imitate is table stakes, not an advantage, and building a strategy on it is the most common strategic error in service businesses.
The TOWS matrix: from inertia to operation
TOWS crosses the four SWOT quadrants to produce four families of action rather than four lists:
| Combination | Strategy type | Question it answers |
|---|---|---|
| Strengths and Opportunities | Attack | Which strength do we point at which opening, now? |
| Strengths and Threats | Defend | Which strength blunts which threat? |
| Weaknesses and Opportunities | Build | What must we acquire to take an opening we currently cannot? |
| Weaknesses and Threats | Avoid | Where should we simply not compete? |
Every cell should produce a named owner, a date and a measurable criterion. A TOWS matrix without owners is a SWOT with more boxes.
The Three Horizons model: spreading strategy over time
Three Horizons separates actions by their time to contribution. Horizon one defends and extends the current business. Horizon two builds the adjacent business that will carry growth in two to three years. Horizon three tests the options that may matter in five.
The value of the model is not the three boxes but the budget discipline that follows: each horizon gets its own budget, its own success criteria and its own review cadence. Judging a horizon-three experiment by horizon-one revenue metrics kills it, which is precisely how most organisations lose their future business while thinking they are being rigorous.
Analysis and Reporting
Core calculations
Six calculations carry most of the analytical weight: market size across the three layers, compound annual growth rate over a stated period, concentration through CR4 and HHI, profit pool by link, share of search and share of model, and unit economics for the offer being considered. State the formula and the period next to each figure; a number without its window is not evidence.
Dashboard and visualisation
The dashboard should answer four questions in order: how big is the opportunity, how crowded is it, where does the money sit, and where are we today. One chart per question. Resist the urge to plot everything on one axis; market size in currency and visibility share in percent do not belong on the same scale, and combining them creates an impression rather than a finding.
The report template: eleven sections
- Executive summary with the decision being recommended.
- Market definition and boundary, stated explicitly.
- Market size across TAM, SAM and SOM with method and assumptions.
- Customer segments and the jobs behind them.
- Macro environment, with each factor tagged act, watch or ignore.
- Industry structure and concentration.
- Profit pool and value chain.
- Competitive landscape and strategic groups.
- Digital demand, including search, competitor footprint and SI visibility.
- Strategic implications through VRIO and TOWS.
- Ninety-day plan with owners, dates and decision points.
Anything that does not change a decision belongs in an appendix, not in the report.
The Ten Most Common Mistakes
- Defining the market by product category rather than by the job, which hides the real competition.
- Presenting SOM as TAM, or mixing units between the two.
- Treating tool traffic estimates as measurements instead of comparable estimates.
- Scoring Porter's forces and stopping, without naming the force that actually constrains margin.
- Ignoring substitutes, particularly SI software and the in-house team.
- Reporting HHI without the market boundary that produced it.
- Confusing revenue with profit in the value chain and growing into the wrong link.
- Filling SWOT from opinion, then skipping VRIO, so table stakes get treated as advantages.
- Measuring SI visibility with a question set that changes between periods, making the trend meaningless.
- Ending the report at findings, with no owner, date or decision point attached to anything.
The Ninety-Day Implementation Plan
The plan below assumes one analyst, access to internal data and a named decision owner. The targets are a working quota for managing the first period, not research findings.
| Period | Work and output | Decision point |
|---|---|---|
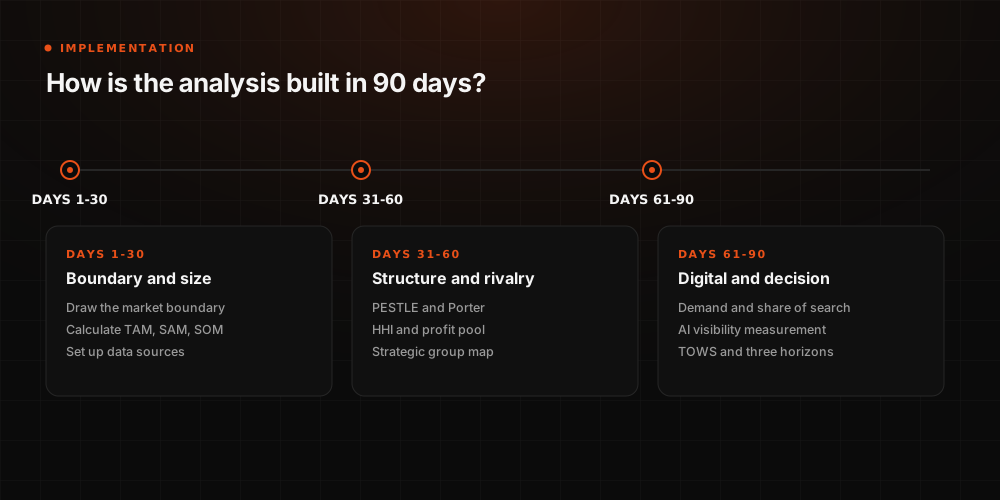
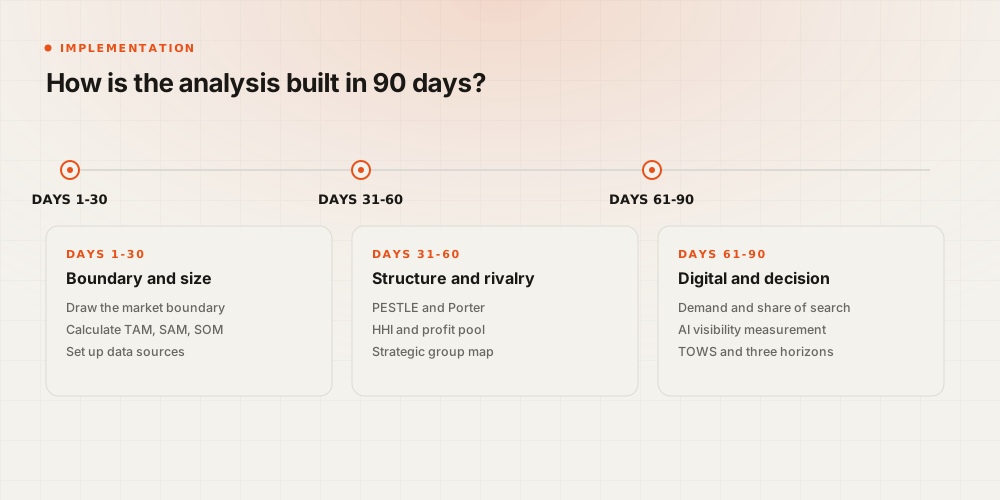
| Days 1 to 30 | Market boundary written; TAM, SAM and SOM calculated both top-down and bottom-up; data sources and collection set up | Do the two sizing methods converge? |
| Days 31 to 60 | PESTLE and Porter completed; CR4, HHI and profit pool calculated; strategic group map drawn | Where does profit actually sit, and can we reach it? |
| Days 61 to 90 | Search demand, share of search, competitor footprint and SI visibility measured; VRIO, TOWS and Three Horizons completed | Which segment do we commit to, and what do we stop? |
Two conditions make the difference between a plan that finishes and one that stalls. Secure interview access in the first week, because it is the longest lead time in the whole schedule. And fix the SI visibility question set before the first measurement, because changing it later destroys the only trend you will have.
Conclusion: Turning Analysis Into Organisational Habit
A market analysis delivered once is a document. A market analysis repeated on a fixed cadence, with the same boundaries and the same question set, is a capability, and it compounds. The second run costs a fraction of the first and produces something the first cannot: a trend.
Three habits carry that capability. Keep the market boundary written down and revisit it deliberately rather than letting it drift. Keep the measurement definitions in one place so a figure means the same thing in March and in September. And keep a decision log, recording what was decided, on what evidence and when it will be reassessed, so the organisation can tell the difference between a strategy that failed and one that was never actually followed.
The SI layer changes what has to be measured, not why. Markets still reward the company that understands where value is created and can prove it. What has changed is that a growing share of that understanding now has to be demonstrated to a model as well as to a person.