AI Integration in Agriculture and Food Technology
Examine AI applications that stretch from the field to the food supply chain, with verifiable examples, investment criteria and readiness steps for 2027.

Current assessment: 29 September 2026. The sections on 2027 set out readiness recommendations; they do not describe realised results or a definitive technology timeline.
In agriculture and food, the value of AI is measured by what its answer changes in the field. A grower choosing irrigation timing more accurately, a factory separating a defective product earlier or a distributor shipping before shelf life runs out are concrete expressions of that value. Successful integration brings reliable data, expertise and an actionable decision together in the same workflow.
For businesses preparing for 2027, the priority is to build these workflows economically and safely. Adding more sensors, launching a chat assistant or buying autonomous equipment does not deliver transformation on its own. Which loss will be reduced, who will approve the decision and how the outcome will be measured should be defined at the start of the investment.
This guide covers the use of AI in crop production, livestock, aquaculture, food processing and the supply chain. By keeping current company disclosures, dated industry data and implementation recommendations separate from one another, it offers a readiness framework for 2027.
What is AI in agriculture and food technology?
AI in agriculture and food technology refers to systems that extract patterns from image, sensor, meteorological, machine, production and commercial data to generate predictions, classifications, recommendations or controlled actions. Use cases range from recognising the symptoms of disease on a leaf to production planning.
Not every digital agriculture application is AI. An irrigation valve that opens at a set time is classic automation. A system that recommends irrigation by assessing soil moisture, weather forecasts and plant development together, on the other hand, may involve AI. This distinction prevents a business from buying a solution that is more complex than it needs.
| Technology | Core function | Example use |
|---|---|---|
| Machine learning | Produces predictions from historical data | Yield, demand and failure forecasting |
| Computer vision | Recognises objects and differences in images | Weeds, fruit defects and animal behaviour |
| Generative AI | Explains information in natural language and produces drafts | Technical documentation assistant and operations summary |
| Agent-based systems | Uses tools and workflows within the limits of its authority | Purchase or maintenance request submitted for approval |
| Robotics and control | Responds physically to a sensed condition | Targeted application, sorting and autonomous movement |
These technologies can work together within the same system. However, a language model producing an explanation and a machine moving safely require different kinds of validation. An assistant’s answer that looks correct does not provide sufficient assurance for a physical application.
What does 2026 data say about the sector?
AgFunder’s 2026 Global AgriFoodTech Investment Report puts investment in the sector in 2025 at $16.2 billion. While this was a decline of around 3% on the previous year, upstream startups focused on farms, food production and biological systems attracted $9 billion in investment; funding in this group rose by 7%. These are general investment figures for agriculture and food technology; they should not be read as revenue for the AI market alone.
From the Webtures perspective, the strategic meaning of this distribution is that viable economics must be visible alongside the technology claim. Which cost a business reduces, who uses the solution and which operational benefit the recurring revenue rests on provide a stronger basis for assessment.
The scale of food waste also shows why decision quality matters. UNEP’s Food Waste Index Report 2024 estimates that 1.05 billion tonnes of food waste, including inedible parts, was generated across retail, food service and households in 2022. Presenting this figure as a new result measured in 2026 would not be accurate. It is a dated reference that explains why demand planning and inventory management matter.
Together, these two data sets point to an opportunity: planning production better and reducing the loss of the value that has already been produced. How much of this opportunity AI captures must be measured separately in each application.
How is AI used in precision agriculture?
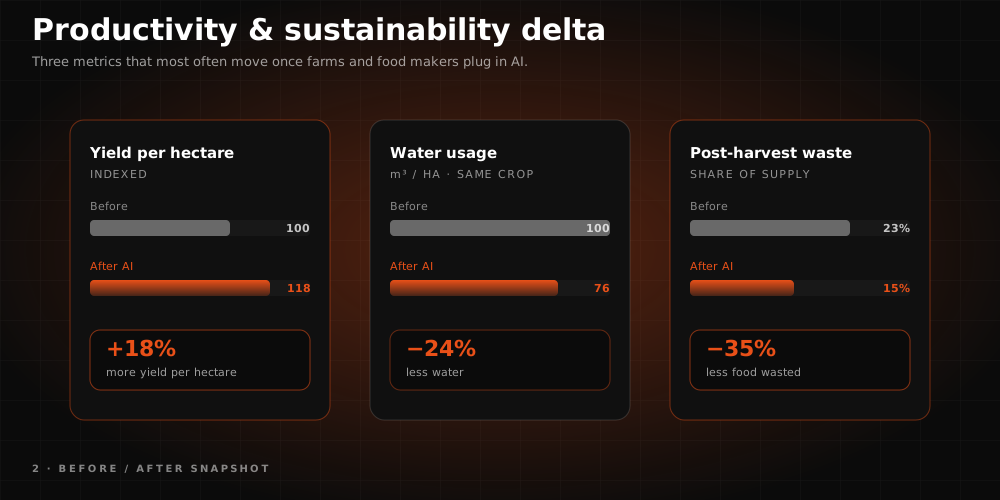
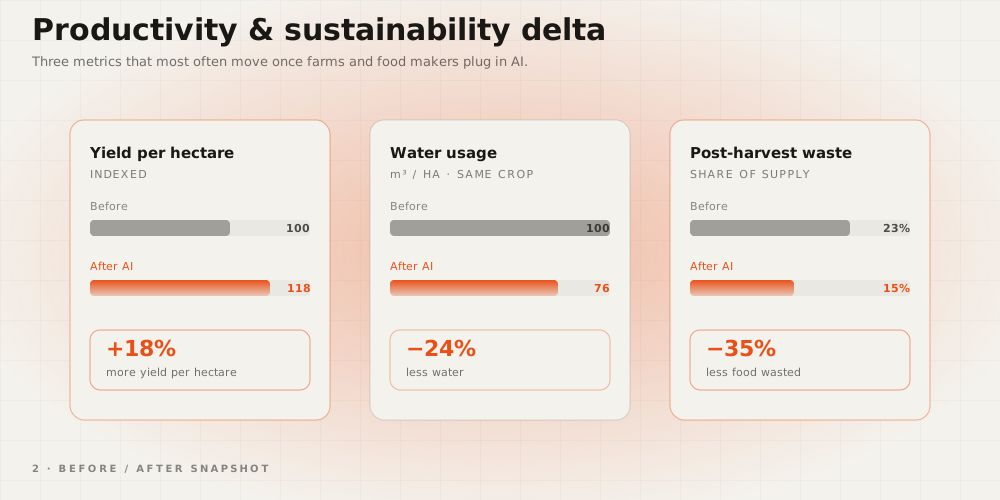
Precision agriculture is based on managing the variation within a single field. Soil structure, moisture, plant density and pest pressure can change across a plot. By combining satellite imagery, field measurements and past applications, AI helps identify the areas that need intervention.
For example, the system may flag an area where growth is weakening. That flag alone, however, does not mean a fertiliser deficiency. Water stress, a drainage problem, disease or a measurement error can produce similar images. The right process is to check the detection in the field and decide on the intervention through agronomic assessment.
Farm performance should not be tracked by output per hectare alone. When marketable quality, input costs, labour, energy and crop loss are assessed together, the real economic outcome becomes visible.
Weed detection and targeted spraying
Targeted application systems that use cameras and on-board processors can spray only at the points where weeds are detected. This separates the treated area from the total field area. The outcome depends on weed density, the crop’s growth stage, visibility conditions and the machine’s operating limits.
John Deere’s November 2025 announcement states that See & Spray was used on more than 5 million acres in the 2025 season and that customers reported an average reduction of around 50% in their use of non-residual herbicides. This is the company’s statement about customer applications; it is not a result that applies to all pesticides or to every farm. The unit of area is the acre, not the decare (dönüm). Five million acres is equivalent to approximately 2.02 million hectares.
When evaluating this kind of solution, a grower should measure the unsprayed area and the spray mix used, and should also track weed control at the end of the season. Less application is meaningful when adequate control is achieved. A reduction in spray-mix volume and a reduction in the amount of active ingredient should also be calculated separately.
Decision quality in irrigation and water management
AI-assisted irrigation can assess root-zone moisture, weather forecasts, the crop’s growth stage, irrigation infrastructure and water availability together. The aim is to meet the plant’s needs at the right time and reduce unnecessary application.
The first condition for measurement is a reliable sensor. A sensor installed at the wrong depth or with degraded calibration can mislead even an advanced model. Measurement points that are representative of different soil types should be selected, and a safe schedule should be defined for use when data is missing.
Success should not be judged solely by a reduction in pumped water. Water per unit of marketable produce, energy costs and crop quality should be tracked together. Water withdrawal at field level and actual water consumption at basin level are not the same indicator. A water-saving claim should state clearly within which boundary it was measured.
Plant diseases and yield forecasting
Image models can recognise symptoms on leaves and fruit and prioritise expert inspection. Early warning supports regular monitoring across large areas. However, similar symptoms can have different causes; a prediction generated from a photograph is not always a definitive diagnosis.
For low-confidence results, an application should direct the user to take a new image, carry out a field check or seek an expert assessment. Performance should be tracked separately by crop, variety, region and lighting conditions. High accuracy on laboratory images does not show that the same performance is achieved in the field.
In yield forecasting, using an uncertainty range rather than a single definitive figure strengthens planning. The forecast is updated as rainfall, temperature and disease pressure change. Purchasing, storage and sales teams can prepare alternative scenarios based on this range.
Data leakage must be prevented in model validation. Having very similar images from the same field in both the training and the test set can make performance look higher than it is. Tests on a new season, a different farm and a different region provide stronger evidence about real-world use.
Autonomous machines and agricultural robots
Autonomous navigation, mechanical weed control and robotic harvesting are at different levels of maturity. The requirements of a machine working in a flat field with clear boundaries are not the same as those of a robot picking delicate fruit. Investment decisions should be made task by task.
When evaluating a robot, hourly capacity, the frequency of human intervention, crop damage, maintenance time and the number of days it can operate all matter. Uninterrupted operation in a promotional video does not show the capacity that is available across a season.
For 2027, the purchase specification should be explicit about behaviour when connectivity is lost, physical stopping, a safe working zone, operator training and access to service. A week-long breakdown during peak production can change the total annual cost calculation. Local maintenance capacity should be assessed as carefully as software capability.
AI in livestock and aquaculture
In livestock farming, data on movement, feed intake, rumination, temperature and images can support herd management. By flagging deviations from usual behaviour, the system can prioritise the animals that need to be checked. The value of early warning emerges from how quickly and accurately the care team responds to it.
The false-alarm burden is a critical indicator here. A system that constantly generates unnecessary notifications can lead staff to overlook real risks as well. Animal welfare, health outcomes and veterinary assessment should be included in the measurement framework. A behavioural prediction should not be used as an automatic treatment decision.
In aquaculture, cameras, sonar, dissolved oxygen and temperature measurements can support feeding and biomass assessment. However, turbidity, stocking density and equipment fouling affect data quality. While feed costs are being reduced, growth, health and environmental conditions should be tracked together.
Greenhouses and controlled-environment production
Greenhouses depend on a constant balance between temperature, humidity, light, irrigation and ventilation. By modelling the effect of these variables on crop development and energy costs, AI can provide decision support to the operator.
A digital twin helps explore alternative control scenarios by building a representation of the physical facility that is updated with data. However, how well the model represents the real facility must be validated. Gains in simulation cannot be reported directly as realised savings.
In controlled-environment production, the economic assessment should cover energy prices, capacity utilisation, the product’s selling price and depreciation. A high level of automation does not guarantee profitability on its own. The priority is to establish sustainable unit economics for a specific product under specific market conditions.
Quality control and production optimisation in food processing
On food processing lines, vision systems can classify shape, colour, size, packaging and visible defects. With suitable sensors and validation, measurements of other physical or chemical properties can also be brought into the process. Which defect is detected by which method should be clearly defined.
A quality control system creates two different costs: rejecting a compliant product as defective and letting a defective product through. An overall accuracy percentage can hide this balance. Especially for rare but critical defects, the miss rate and the verification sample should be reported separately.
It cannot be assumed that a camera system detects all pathogens, allergens or chemical hazards. AI should be designed as a component that supports the business’s validated food safety plans, the required laboratory testing and expert responsibility.
In predictive maintenance, equipment checks can be prioritised using vibration, temperature and failure records. The measure of success is not prediction accuracy alone. Unplanned downtime, maintenance costs, product loss and unnecessary interventions should be tracked together.
Forecasting and operations must work together to reduce food waste
Demand forecasting supports production and inventory decisions. However, even if forecast error falls, waste can stay the same if ordering rules do not change. How the model’s output is carried into purchasing, production and shipping decisions is part of the design.
For short shelf-life products, the remaining shelf life of each batch is needed alongside the stock quantity. Shipping first the product that expires first is different from moving goods only in the order they entered the warehouse. Temperature history can also be included in the risk assessment within an appropriate validation framework.
Discount recommendations in retail, preparation quantities in food service and the classification of kitchen waste are different use cases. Revenue from discounted products may rise while total margin falls. For this reason, waste reduction should be measured together with gross profit, service levels and customer experience.
Traceability and the cold chain
Traceability requires reliable knowledge of which batch, facility, shipment and supplier a product is linked to. AI can find inconsistent records, prioritise temperature excursions and speed up incident investigations.
The core requirements are shared identifiers, accurate timestamps and data matching across systems. Information entered incorrectly at source does not become correct when it is transferred to an immutable record system. Nor is the use of blockchain, on its own, proof of product safety or certificate validity.
In the cold chain, it should be decided in advance who an alarm goes to, which load is placed under review and under what conditions a shipment is stopped. The outcome being controlled is not just how quickly alarms are generated, but whether at-risk products are managed correctly.
Product development and food R&D processes
AI can classify consumer feedback, narrow down formulation options and support experimental design. This approach helps researchers decide which combinations to try first.
A generated recipe or product idea should be assessed separately for sensory acceptance, stability, manufacturability and regulatory compliance. Creating hundreds of concepts does not mean that the same number of products reach the market. R&D performance should be tracked through validated prototypes, learning per experiment and commercialisation outcomes.
In precision fermentation and alternative ingredients, AI can support the evaluation of experimental conditions. However, moving from the laboratory to industrial scale also involves process stability, energy, raw material and quality costs. The success of a digital model does not validate the entire biological production process.
Generative AI and agricultural knowledge assistants
One of the strongest use cases for generative AI is making scattered technical knowledge accessible. An operator can query maintenance documentation, a grower can query product information and a quality specialist can query the relevant procedure in natural language.
The Bayer case study Microsoft published in February 2025 describes an assistant prototype that provides access to agronomy knowledge, developed in a collaboration that Bayer and Microsoft carried out with a consulting partner. The work uses a RAG approach, which generates answers by retrieving relevant information from trusted internal and external sources. This example illustrates a knowledge-access architecture; it should not be interpreted as a proven yield increase for all farmers or as a completed global rollout.
A good assistant should show the source and date of its answer and distinguish between product, geography and conditions of use. If the information is insufficient, it should say so and refer the question for expert review. A fluent answer based on an outdated product document is not a reliable answer.
Where can agentic AI be used in agriculture and food?
Agentic AI can go beyond providing information and run workflows using specific tools. For example, it can review a maintenance record, check whether a part is in stock and prepare a request for the responsible person’s approval.
Authority should be granted in proportion to the task. Reading data, creating drafts and initiating physical actions are separate access levels. Text in a supplier document should not be accepted as an instruction that changes the agent’s authority. External content should be handled as untrusted data.
| Level | Suitable starting use | Required control |
|---|---|---|
| Information access | Searching procedures and records | Source, currency and access rights |
| Recommendation | Maintenance or order draft | Expert review and rationale |
| Limited action | Creating an approved work order | Action limit, logging and re-check |
| Physical execution | Equipment or production control | Separate safety validation and a stop mechanism |
In 2027, starting the first investment with low-risk information and operational tasks creates room to observe the system’s errors. Critical decisions on irrigation, chemical application or food safety require stronger validation and authority design.
How should the technical infrastructure be built?
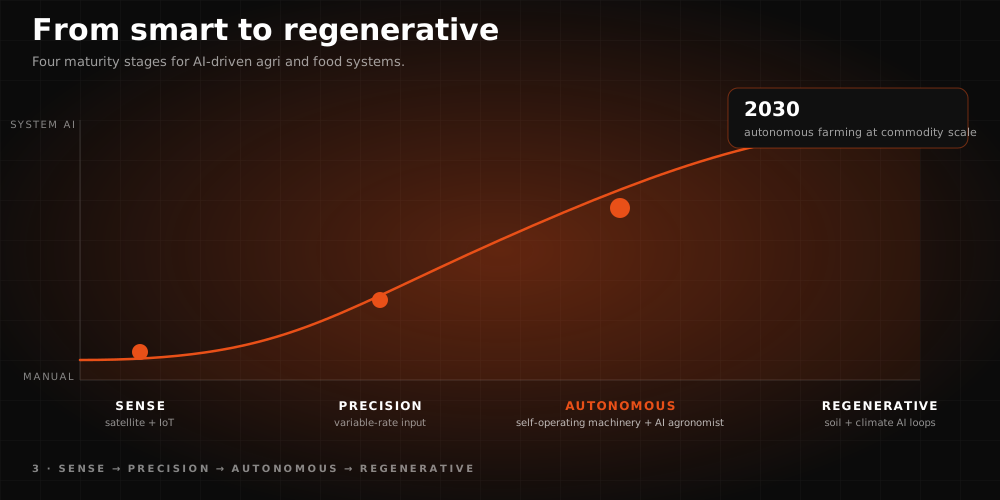
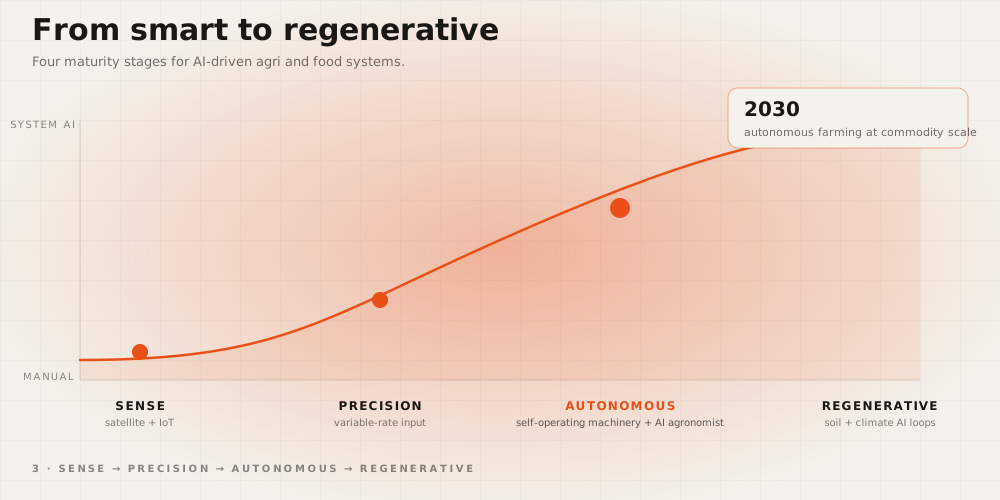
The first step, before choosing a model, is matching the data. Field, animal, product, batch, machine and customer records need to be kept with consistent identifiers. If it is not known where, when and with which device a measurement was taken, the analysis loses its reliability.
The recommended architecture consists of data collection, quality control, analytics, decision and outcome logging layers. The data version, model version and approval record behind each decision should be traceable. Outcomes should flow back into the system to inform the next assessment.
| Layer | Design question | In practice |
|---|---|---|
| Data collection | Is the measurement reliable and representative? | Sensor calibration and missing-data checks |
| Data integration | Do the records describe the same product or area? | Standardisation of identifiers, units and time |
| Model | Does performance hold under new conditions? | Testing by season, facility and product |
| Decision | Which action will the output change? | Authority, approval and safe limits |
| Monitoring | Are outcomes and errors visible? | Action log, feedback and a rollback plan |
On-device processing becomes important for real-time machine control and for tasks where connectivity is weak. Central reporting, long-term analysis and model development can run in the cloud. In a hybrid architecture, which functions continue during an internet outage should be clearly defined.
Accessible integration for small producers
The investment model of large businesses cannot be applied directly to small producers. Upfront cost, connectivity, maintenance, language and digital skills can all be barriers to adoption. The economic value of a solution should be calculated at the user’s real scale.
Alternatives include shared equipment through cooperatives, pay-per-service models, shared sensor infrastructure and adviser-supported implementation. Smartphone access can be an advantage; however, photo quality, local crop knowledge and expert support still matter.
Data portability is also a purchasing criterion. Producers should know in which format they can retrieve their historical records if they change provider. Long-term lock-in costs should be assessed as carefully as ease of use.
Data security and operational responsibility
Agriculture and food data can include sensitive information about production volumes, supplier relationships, recipes and commercial terms. Access should be restricted by job role, service accounts should be kept separate from personal accounts and critical actions should be logged.
Update, backup, network segmentation and remote access processes should be designed for connected machines. Physical processes should be protected from unexpected behaviour by a cloud service or a model. Model errors, sensor failures and connectivity outages should be tested as separate scenarios.
Contracts should be clear about the purpose of data use, retention periods, use in model development, sub-processors and exit terms. If employee images or personal information are processed, the obligations in the relevant market should be assessed separately. Using AI does not transfer the business’s product and operational responsibility.
How is sustainability impact measured?
An AI-assisted application can reduce input use under the right conditions. However, a sustainability claim requires comparable baseline data and a clear measurement boundary. Water, energy, active ingredient, waste and emissions are not interchangeable.
For example, energy per hectare may fall while total energy rises because the total production area has grown. When emissions per unit of product fall, how total emissions have changed should also be reported. Assessing savings together with production volume and quality makes this difference visible.
Remote sensing or model estimates can support monitoring and verification processes. On their own, they do not create a carbon credit, a certification or proof of environmental compliance. The verification method that the claim requires should be applied separately.
How is the return on an AI investment calculated?
The economic assessment should compare the total annual benefit with the total cost of ownership. Alongside hardware and licences, integration, data preparation, maintenance, training, connectivity and operational disruption should also be taken into account.
Hypothetical example. The example below is entirely hypothetical; it is not a Webtures client result or an industry average. For a solution added to existing equipment, assume an upfront investment of $40,000, verified annual input savings of $30,000 and additional annual operating costs of $10,000.
| Item | Assumption | Note |
|---|---|---|
| Upfront investment | $40,000 | Including integration and installation |
| Annual gross savings | $30,000 | Should be based on a measured comparison |
| Additional annual cost | $10,000 | Licence, maintenance and support |
| Annual net cash benefit | $20,000 | 30,000 minus 10,000 |
| Simple payback period | 2 years | Excluding financing, tax and discounting |
If savings fall to $15,000, the annual net benefit becomes $5,000 and the simple payback period becomes eight years. This sensitivity shows how usage intensity and field conditions change the investment decision. A more comprehensive assessment should also model cash flow, equipment life and financing costs.
Time saved on labour does not always create an equivalent cash saving. An employee moving to a more valuable task is a capacity benefit; it should be reported separately from an actual cost reduction that leaves the budget.
Implementation roadmap for 2027
The readiness timeline should be arranged around the crop’s biological cycle and the business’s production plan. The same month can fall into different production stages in the northern and southern hemispheres. A food factory can run many comparisons in a short time, whereas an open-field application may require a full season.
Define the problem and the baseline in the first 30 days
Choose a single priority loss. Define a measurable problem such as irrigation costs, sorting errors, unplanned downtime or stock shrinkage. Review the availability and quality of the data. Identify the business owner, the responsible expert and the success metric.
Set up a controlled trial between days 31 and 60
Test the solution on a limited area, product or line. Use a comparison group where appropriate. Observing the model’s recommendations first, without changing the real operation, can help surface errors at lower risk. Test missing-data and system-outage scenarios.
Make a technical and operational decision between days 61 and 90
Assess the usage rate, false alarms, data quality and fit with the workflow. This stage is the first decision point for scaling; it does not mean that all agronomic outcomes have been proven. The necessary season or production cycle must be completed for yield and quality.
Reassess the conditions for scaling at the end of the season
Review the economic and operational outcome under comparable conditions. Revalidate when moving to another product, facility or region. Instead of making claims that go beyond the scope of a successful pilot, document the conditions under which it worked.
Indicators the management team should track
| Indicator | How it is tracked | Why it matters |
|---|---|---|
| Economic outcome | Total cost per unit of marketable produce | Prevents savings from hiding a loss of quality |
| Operational performance | Downtime, interventions and task completion | Shows the system’s real operating capacity |
| Model reliability | Missed critical events and false alarms | Exposes the risk that average accuracy hides |
| Resource use | Water, energy and inputs per product and per area | Makes measurement boundaries comparable |
| Adoption | Recommendations acted on and reasons for rejection | Shows user trust and process fit |
| Data health | Missing records, latency and calibration | Makes the source of a problem visible early |
The direction of AI in agriculture and food beyond 2027
In Webtures’ assessment, one of the strongest areas of development in the coming period will be the convergence of image, sensor and operational data within the same decision process. This approach covers not only anomaly detection but also which intervention to make and how its outcome will be tracked.
The expansion of agentic systems into tasks such as information search, maintenance coordination and purchasing preparation is a reasonable scenario. Full autonomy, however, will advance according to the task, safety and economic conditions. A definitive timeline in which all farms or food facilities operate without people from the same date is not realistic.
For 2030 and beyond, competitive advantage may accumulate in high-quality historical data, operational knowledge, expert teams and the ability to make different systems work together. That is why the data discipline established today matters in the long term. A knowledge infrastructure that remains usable when models change offers more room to manoeuvre than an investment tied to a single technology.
The Webtures view: from production data to commercial trust
Making the technical capability of agriculture and food companies understood in the market is also part of the transformation. When product specifications, origin, storage conditions, certifications and performance claims are not presented accurately and kept up to date, strong operational capacity may not be reflected in commercial communication.
From the Webtures perspective, AI visibility is a concrete data matter here. When a purchasing team or an AI assistant examines a brand, it should be able to understand what the product is, under which conditions it can be used and what supports its claims. Consistency between product pages, technical documentation and distributor records supports this trust.
For this reason, three workstreams can be addressed together for agriculture and food brands: standardising product information, strengthening expert content with evidence and designing the AI workflows that provide access to information. This structure does not guarantee inclusion in model answers; it makes it easier for verifiable information to be found and interpreted correctly.
Preparing for 2027 can start with one of the most important decisions a business makes: which data do we trust, which action does that data change and how do we verify the outcome? Clear answers to these questions turn an AI investment into a measurable development programme.
Frequently asked questions
Where is AI used in agriculture?
It can be used in crop health monitoring, targeted application, irrigation, yield forecasting, animal behaviour tracking, robotics and operations planning. Suitability is assessed according to the crop, data quality, infrastructure and economic conditions.
How much does AI increase yields in agriculture?
There is no single rate that applies to all businesses. Some applications aim to sustain the same output with fewer inputs rather than to increase yield. The impact should be measured with a comparison group and a sufficient number of production cycles.
Does smart farming require a constant internet connection?
Not for every task. Properly designed on-device systems can perform some operations offline. Connectivity may be needed for central synchronisation and remote management; behaviour during an outage should be defined in advance.
Will AI replace experts in food safety?
AI can support inspection and early warning. Validated control processes, the required testing and assessment by a responsible expert remain in place. A system finding visible defects does not mean that it detects every food safety hazard.
Where should a small business start?
It should start with a narrow use case where data already exists and costs can be measured. Shared services, leasing or pay-per-use options can be alternatives to a high upfront investment.
Can an AI assistant recommend fertilisers or pesticides?
It can support access to technical information; however, a general model answer should not be used as an application instruction unless the crop, field conditions and applicable rules of use have been verified. Critical decisions should be made with an assessment by an authorised expert.
Is a 90-day pilot enough?
It can provide important information about technical integration and user experience. It may not be sufficient for seasonal yield, quality and lasting economic impact. The evaluation period depends on how long it takes for the measured outcome to emerge.
What should agriculture and food brands do for AI visibility?
They should keep product and company information consistent, explain technical claims together with their supporting evidence, make current documentation accessible and use machine-readable data structures. Accuracy and trust should be monitored as well as visibility.