

Two customers who buy the same product from the same online store may be solving completely different problems. One is waiting for next-day delivery, another cares about how long the product lasts, a third is looking at total cost. Two companies in the same industry also evaluate the same software for different reasons: one wants to manage a growing operation, the other wants to reduce the risk created by its current system.
Audience segmentation makes those differences visible so a business can decide which value it offers to which customer. Good segmentation can be used in product, pricing, content, sales, advertising and customer experience decisions. Its success is judged less by the number of profiles produced than by the results showing how accurate those decisions turned out to be.
The starting point this guide recommends is to take customer need as the main axis and enrich it with buying context, observed behaviour and economic value. Demographic or firmographic information is added to the model to the extent that it explains service conditions and decisions. That way a business can develop offers suited to today's demand while also understanding future buyers.
The methods below can be adapted to both B2C and B2B businesses. The numeric worked examples and the unnamed business scenarios are illustrative; they are not presented as realised client results.
What is audience segmentation?
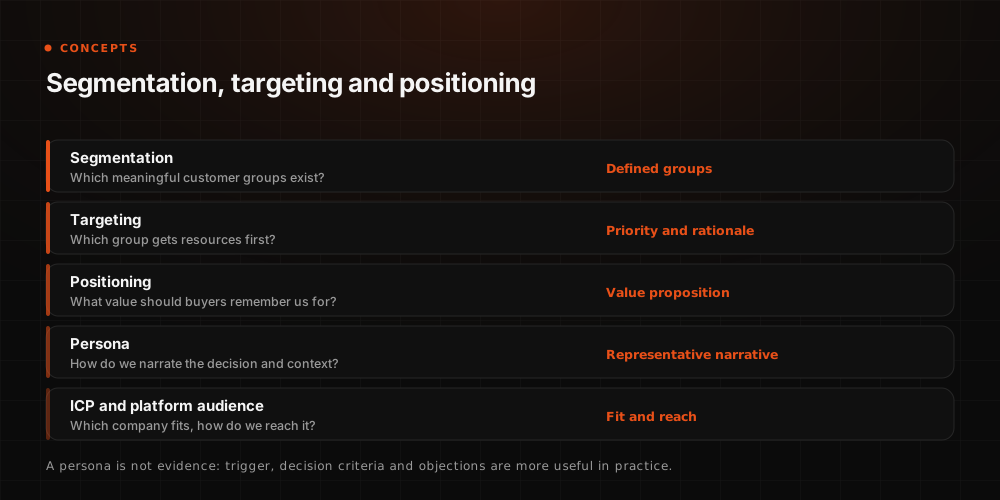
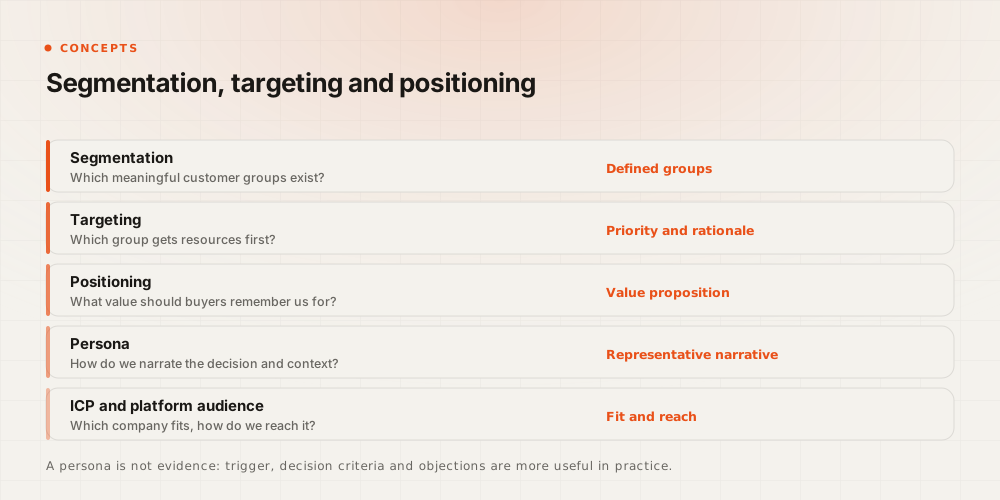
Audience segmentation is the process of dividing a market or a customer base into meaningful groups by their needs, behaviours, circumstances or commercial value. "Meaningful" here refers to a distinction that requires the business to make a different decision. If two groups differ in age but experience the same problem, look for the same evidence and respond similarly to the same offer, the age split may carry limited value for that decision.
Market segmentation also covers potential buyers. Customer segmentation examines the existing customer base. That distinction matters for growth: learning only from today's customers can miss the needs of groups that do not yet choose the brand. Qualtrics' explanation of customer segmentation separates these two scopes.
The difference between segmentation, targeting and positioning
The STP model organises three connected decisions: segmentation creates the groups, targeting selects the priority groups, and positioning determines which value the brand will occupy in the minds of the chosen buyers. Channel selection and campaign setup are the implementation steps of those decisions.
| Concept | Question it answers | Concrete output |
|---|---|---|
| Segmentation | Which meaningful customer groups exist? | Groups with defined needs and distinguishing conditions |
| Targeting | Which groups should get our resources first? | Priority segments and the rationale for investing in them |
| Positioning | What value should these buyers remember us for? | A value proposition and the evidence supporting it |
| Persona | How do we narrate the decisions and context in this group? | A research-based representative customer narrative |
| Ideal customer profile (ICP) | In B2B, which companies fit our solution? | Company-level fit and exclusion criteria |
| Platform audience | How do we reach the chosen group inside this system? | A CRM list, an ad audience or an analytics condition set |
A persona can make segment research legible inside a team. But adding a fictional name, a photo and hobbies is not evidence on its own. The purchase trigger, the problem to be solved, the decision criteria and the objections are more useful in most applications.
Which business decisions does segmentation improve?
A segmentation project should open with "Which decision will we make better?" rather than "How many profiles will we produce?" Entering a new market, increasing repeat purchase and prioritising enterprise sales opportunities all require different data and different methods.
| Business goal | Decision expected from segmentation | Result to track |
|---|---|---|
| New customer acquisition | Which need gets which offer and message | Acquisition cost and first-period contribution |
| Growth in existing customers | Which usage need gets which complementary solution | Additional contribution, repeat purchase, retention |
| Product development | Which problem is solved first, and for whom | Usage, adoption and commercial demand |
| B2B sales efficiency | Which accounts and stakeholders come first | Qualified opportunities, win rate, sales cycle |
| Content and SI visibility | Which questions are answered with which evidence | Relevant visibility, qualified demand, conversion |
Economic value and the company's capacity to serve should be assessed together. A segment that looks large may not produce the expected contribution if it drives high returns, heavy support or expensive integration. Established segmentation frameworks likewise handles customer needs, profitability and the company's ability to serve the chosen group together.
How broad reach and segmentation work together
Segmentation does not require splitting every marketing activity into small audiences. A brand can build awareness across the wide buyer base in its category while developing different content, offers or services for specific purchase situations. The scope of broad reach is set by the market that can actually be served; a business operating in one city and a brand with national distribution do not have the same reach objective.
The 95-5 approach that the LinkedIn B2B Institute grounds in Ehrenberg-Bass research emphasises that, especially in categories with long purchase intervals, many potential customers are not buying today. The lesson is to think about future demand as well. "95%" should not be used as a measured constant for every category or as an advertising budget split. LinkedIn B2B Institute, 95-5 Rule.
In practice two questions are managed together: "Which information makes today's evaluating customer's decision easier?" and "When the need arises later, which situation should our brand be remembered alongside?" Segment research can feed both. Budget allocation is then set by category, competition, cash flow and measurement results.
Types of audience segmentation
Each segmentation type answers a different question. Choosing correctly means looking at the business decision before looking at the variables that happen to be easy to obtain.
| Approach | Difference examined | Example use | What to watch for |
|---|---|---|---|
| Demographic | Age, life stage, household structure | Product suitability and access conditions | Do not infer motivation automatically from age or gender |
| Geographic | Region, language, climate, delivery and service coverage | Regional offers and logistics planning | Location does not explain the whole need |
| Psychographic | Values, attitudes, priorities | Research-validated decision criteria | Stated attitude and actual behaviour can diverge |
| Behavioural | Usage, purchase, channel and interaction | First purchase, repeat purchase, product adoption | A single action is not conclusive proof of intent |
| Needs-based | The problem to solve and the outcome sought | Easy setup, time saving, operational assurance | Needs must be defined through research |
| Situational | The event or moment that starts the purchase | Moving house, renewal, a new branch, urgent delivery | The same customer can be in a different situation at another time |
| Value-based | Contribution, cost, past and expected value | Planning retention and service levels | Separate revenue from profit, and past value from potential |
| Firmographic and technographic | Company size, sector, systems and integrations | Assessing B2B fit and implementation difficulty | Companies in the same sector can buy very differently |
A business does not have to use all of these. In a local maintenance service, geography and time availability may be a strong start. In a retailer with a high repeat-purchase rate, behaviour and value analysis may support more decisions.
When is demographic information not enough?
"Aged 25-40, metropolitan, middle-to-upper income" does not on its own say which objection to resolve or which product feature to lead with. Within that same profile, one customer may prioritise ease of setup, another durability, a third compliance with a specific measurement.
Netflix's own explanation is a concrete example of behavioural data in use. The company states that its recommendations consider inputs such as viewing history, similar tastes, content attributes and usage context, and that it does not include demographic information like age and gender in that recommendation decision. That is how one particular recommendation system works; it is not proof that demographic data is unnecessary in every industry. Netflix recommendation system.
How do you combine need, buying context and value?
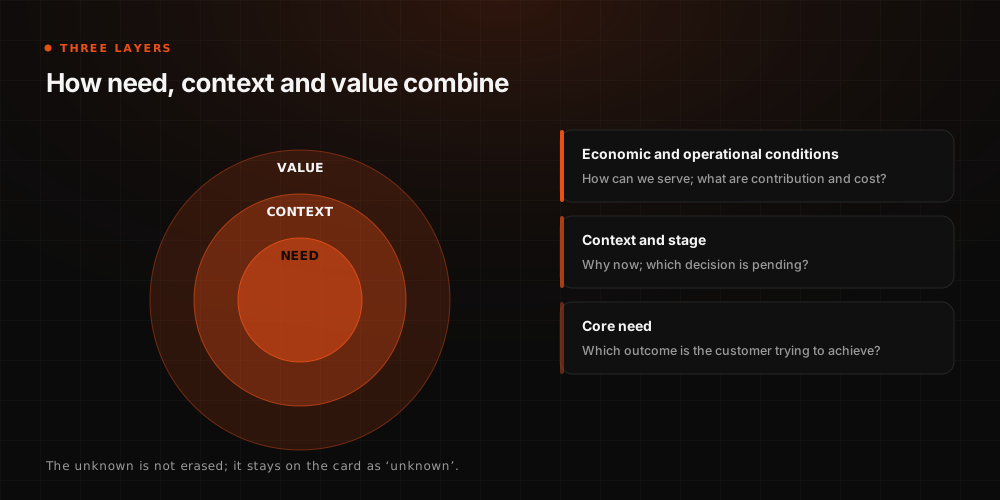
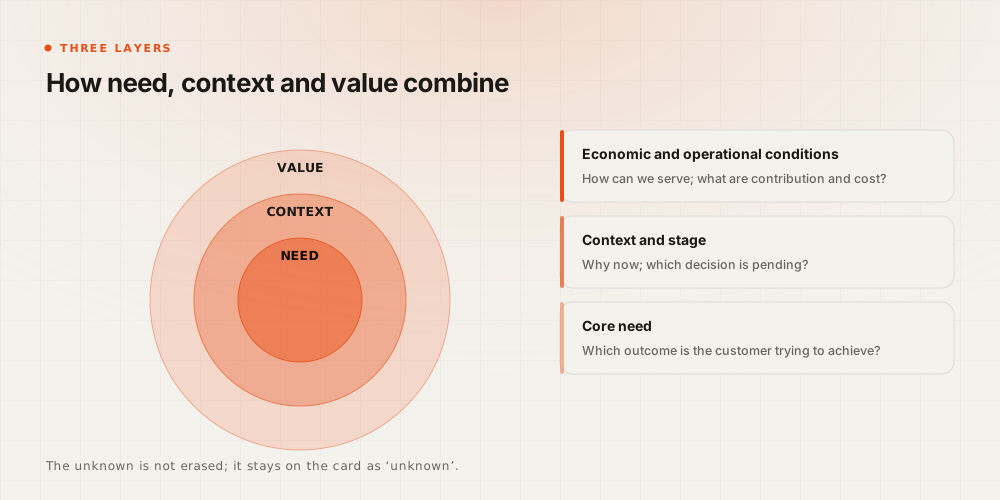
For a manageable structure it helps to use three layers rather than compressing every customer attribute into a single segment name:
- Core need: which outcome is the customer trying to achieve?
- Context and stage: why are they evaluating it now, and which decision is pending?
- Economic and operational conditions: how can this customer be served, and what are the expected contribution and cost?
For example, instead of "a high-income user aged 30-45 living in Istanbul who visited the pricing page", this record produces more decisions: "Looking for a solution they can install themselves; comparing two alternatives; inside the delivery area; need is stated; economic value not yet known." The second version keeps the unknown visible as well.
Making the Jobs to Be Done question concrete
Jobs to Be Done focuses on the progress a customer uses a product to make. During research this sentence structure can be used: "When I am in ... situation, I want to be able to ..., so that I can reach ... outcome."
Example: "When I am moving into a new home, I want to understand the dimensions and assembly requirements of the furniture in advance, so that I do not have to deal with a mismatch after delivery." Here the size guide, the delivery information and the assembly explanation are as much a part of the value proposition as the product choice. A finding like that leads to a different implementation than discount-led communication.
The related concept of category entry points also helps you think about which event, need or context the brand should be remembered in. "Moving house" is a trigger; "reducing the risk of choosing the wrong size" is the outcome sought; "assembly guide" is a possible solution component. Writing those fields separately makes the move from research to campaign easier.
Not trapping the customer in a permanent label
A person's priorities when shopping for themselves can differ from their priorities when buying a gift. In B2B the same company can make different decisions during a new implementation and during a contract renewal. Need labels can therefore be held at product, account, order or opportunity level; the unit of analysis should be defined from the outset.
Nor should purchase stages be assumed to progress linearly. Google's "messy middle" research draws attention to the repeated movement between exploration and evaluation. In practice that means assessing several signals together with the customer's own statement, rather than assigning a definite stage from a single page view. Google, purchase decision research.
How is audience segmentation done?
Step 1: Write the decision, the scope and the success measure
Start the work with a decision sentence: "We will identify the obstacles that first-time customers face before their second purchase, and choose the intervention that increases 90-day contribution per customer." A definition like that explains which customers will be examined and which results matter.
The starting document should contain the product or category, geography, unit of analysis, data period, implementation channel and decision owner. In a B2B business with a long sales cycle, the first measurement period may only show opportunity quality. When revenue impact will be assessed should be written down separately.
Step 2: Take a data inventory
| Data source | What it can teach | Quality check |
|---|---|---|
| Order and finance records | Purchase frequency, returns, net revenue, contribution | Consistent handling of cancellations, returns, tax and discounts |
| CRM and sales records | Need, decision stage, win and loss reasons | Missing fields, shifting definitions, duplicate accounts |
| Site and app analytics | Usage and evaluation behaviour | Event accuracy, consent scope, identity-matching limits |
| Support tickets and reviews | Problems, objections, usage context | Representation bias and personal information content |
| Customer interviews | Trigger, alternatives, decision criteria | Participant selection and leading questions |
| Preference centre and short surveys | Directly stated need | Question clarity, recency and non-response bias |
Fix the shared definitions first. If "active customer" means someone who purchased in the past year in the CRM and a current contract holder in finance, the same report may be comparing two different groups. Every core field should have a known source, definition, refresh frequency and owner.
Step 3: Talk to customers and to lost opportunities
Research done only with the happiest customers may fail to explain the situations where the brand was not chosen. New customers, repeat buyers, churned customers, people who requested a quote and walked away, and where possible category buyers who are not yet customers, should all appear in the research design.
Roughly 12-18 interviews can help develop hypotheses in a limited category as a starting point. That number is not a guarantee of representation or saturation. As interviews surface new needs and contradictions, the sample is widened; sufficient depth is sought for separate markets and decision roles.
Questions you can use:
- Can you describe the last concrete event where this need came up?
- How were you solving the problem until then?
- What triggered you to look for a new solution?
- Which alternatives did you evaluate, and why did you rule some out?
- Which information did you find hardest to trust while deciding?
- Who did you consult before buying, and which sources did you look at?
- What kind of question did you type into a search engine or an SI tool?
- After buying, how did you know you had made a good choice?
Instead of hypothetical, leading questions such as "Would you have bought it if there had been a discount?", investigate the details of the last decision that actually happened. Tie answers to dates, products and context. Do not treat one striking quote as the view of the whole market.
Step 4: Separate findings by level of evidence
Stated need, observed behaviour and the analyst's interpretation should be kept in different fields. "Installation felt difficult" is a customer statement. Opening the installation page three times is an observation. "This person is not confident with technical matters" is an interpretation that needs more evidence.
Build a small evidence table for each segment candidate: the finding, the source, the date, how many separate records show it, counter-examples and uncertainty. Source count alone does not confer representativeness; a hundred reviews from the same campaign can share the same selection effect.
Step 5: Test with quantitative research if needed
Interviews help discover needs; surveys, with the right sampling design, help assess how widespread those needs are and how they relate to one another. Survey questions should use the customer language that emerged in the research and should not impose the answer. If willingness to pay and feature preferences matter, a research design suited to that should be set up separately.
A large total sample does not mean every sub-segment is adequately represented. Sub-group comparisons, non-response effects and the sampling method should be assessed together. Avoid generalising results from an existing-customer survey directly to all category buyers.
Step 6: Turn segment candidates into implementation hypotheses
Next to a name like "those looking for easy installation", add this sentence: "In this group we expect the sizing and assembly guide to reduce decision uncertainty more than a general product description, and to increase post-return contribution." Now there is a testable proposition.
Working with a small number of core segments in the first version makes it easier for teams to produce implementations. In most starting projects, proceeding with 3-5 candidates can be a manageable choice; that number is not a scientific upper limit. A new segment should carry a different decision and an expected result worth implementing.
Which segments should be prioritised?
A segment looking interesting is not enough to earn investment priority. Assess its feasibility first.
| Assessment | Check question |
|---|---|
| Identifiability | Can we explain who enters this group and under which condition? |
| Measurability | What data or reliable estimate do we have for size and value? |
| Reachability | Can we reach buyers with this need through product, distribution, sales or communication? |
| Commercial meaning | Can the expected contribution cover the cost of a dedicated implementation? |
| Decision difference | What will change in the offer, content, service or sales approach? |
| Operability | Do we have a team to keep the data current and run the implementation? |
Prioritisation can weigh need intensity, economic potential, reach, implementation capacity and strategic fit together. The weights below are a management aid suggested as a starting point, not a validated model for predicting success.
| Dimension | Example weight | What a high score means |
|---|---|---|
| Importance of the need | 25% | The problem is clear, high priority and evidence-backed |
| Economic potential | 25% | Strong likelihood of creating value after cost to serve |
| Reachability | 20% | Reaching and serving the relevant buyers is possible |
| Implementation capacity | 20% | Product and team can supply the required experience |
| Strategic fit | 10% | The choice supports the company's direction of growth |
When each dimension is scored 1-5, the score out of 100 is found by multiplying each weight by that score divided by five and summing the results. A segment scoring 4, 4, 3, 5 and 4 respectively receives 80 points. But 80 points does not mean an 80% probability of success.
Rather than giving a low score where there is no data, write "unknown" and state what will be researched. An implementation that is legally impossible or operationally unsupportable does not become acceptable through a high total score. If the ranking keeps changing when you vary the weights within reasonable bounds, make the uncertainty of the decision visible.
Thinking about market size at segment level
TAM expresses the total potential market, SAM the market reachable within the scope of the solution and service you can offer, and SOM the portion you can realistically win in a given period. When calculating these at segment level, show customer counts, annual demand and price assumptions separately. Adding up overlapping need groups can count the same buyer twice.
A segment's share inside your current CRM is not its share of the whole market. The estimated reach shown by an advertising platform is likewise not the same measurement as a de-duplicated market size. Estimated ranges, data sources and uncertainties should be presented together.
Customer segmentation with RFM analysis
RFM is a practical method that evaluates customers through three attributes of their purchase history. It can be used as a starting analysis in business models where repeat purchase is meaningful.
- Recency, time since the last purchase: how long ago the customer's most recent purchase occurred, relative to the analysis date.
- Frequency, purchase frequency: the number of purchases in the defined observation period.
- Monetary, amount spent: the monetary total of purchases in that same observation period; in this guide's example, the net amount after returns and discounts, excluding tax.
These definitions must be applied identically across the whole dataset. Confusing session counts with purchase frequency, or using lifetime spend for some customers and last-year spend for others, breaks the comparison. PyMC-Marketing's RFM documentation offers a technical example of applying the method to customer groups.
A simple RFM example
In the hypothetical table below the observation period is the last 365 days. Because contribution costs have not yet been added, the spend column does not show profitability.
| Customer | Days since last purchase | Order count | Net spend | First reading |
|---|---|---|---|---|
| A | 8 | 9 | 18,000 TRY | Recently purchasing, repeat customer |
| B | 210 | 8 | 17,000 TRY | Previously repeat customer, quiet lately |
| C | 5 | 1 | 2,500 TRY | New, or only one purchase observed so far |
| D | 40 | 3 | 3,600 TRY | Regularity to be compared with the category cycle |
This table is not itself a campaign decision. Re-engagement can be considered for customer B; but if the product is bought once a year, 210 days may be normal. Customer C's low order count is not evidence of low future value either; the first order date and the observation window have to be taken into account.
If you score, each dimension can be classified on a 1-5 scale, for example. For time since last purchase, a shorter interval scores higher; for frequency and value the direction is reversed. Percentile bands may not produce a meaningful split in small datasets or where the same values repeat heavily. In that case business thresholds suited to the category can be more explainable.
Moving from RFM to implementation
Usage support can be considered for a customer who bought for the first time recently, and a need-appropriate reminder for a customer who used to buy regularly. Which intervention actually works should be measured in a controlled way. Giving every group a discount can reduce the margin on purchases that would have happened anyway.
RFM does not explain why the customer bought. A "high RFM" label therefore supports decisions more strongly when it is read alongside a research-defined need or product usage information.
Moving from past value to future value with CLV
Customer lifetime value (CLV or CLTV) is used to assess the economic value expected from a customer over time. Some implementations build the calculation on revenue, others on contribution or profit. Before comparing, you have to state the definition used, the forecast horizon and which costs have been deducted.
For decision-making, choosing a 6, 12 or 24-month period rather than an unbounded future is a more traceable start for most businesses. Calling such a result "expected 12-month customer contribution" is clearer than an unspecified lifetime value claim.
A simplified calculation can be built as follows:
Expected period contribution = expected number of purchases × expected contribution per order − relationship costs not yet included in this calculation.
In longer-term assessments, each period's expected contribution is discounted to present value at an appropriate rate. If acquisition cost (CAC) is left out of the calculation, the result should be labelled explicitly as "before acquisition cost"; if it is deducted, as "after acquisition cost".
An example showing the difference between revenue and contribution
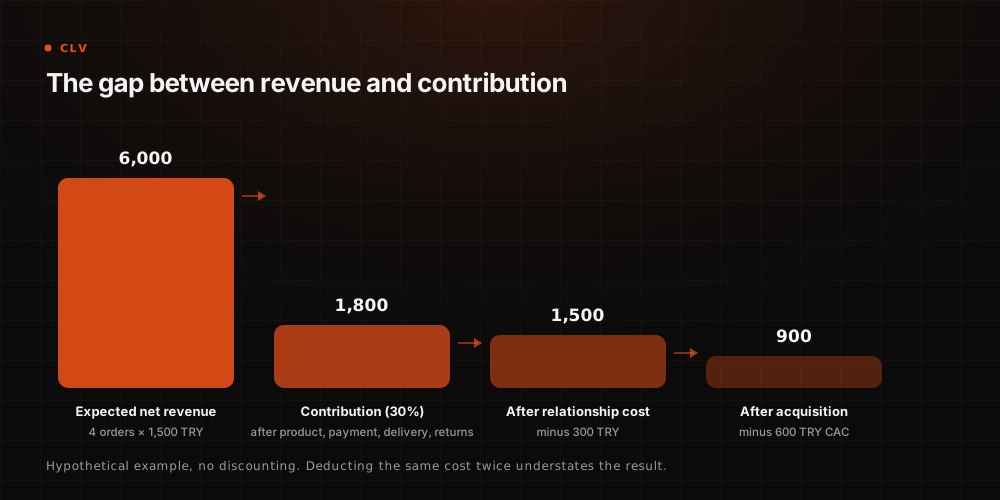
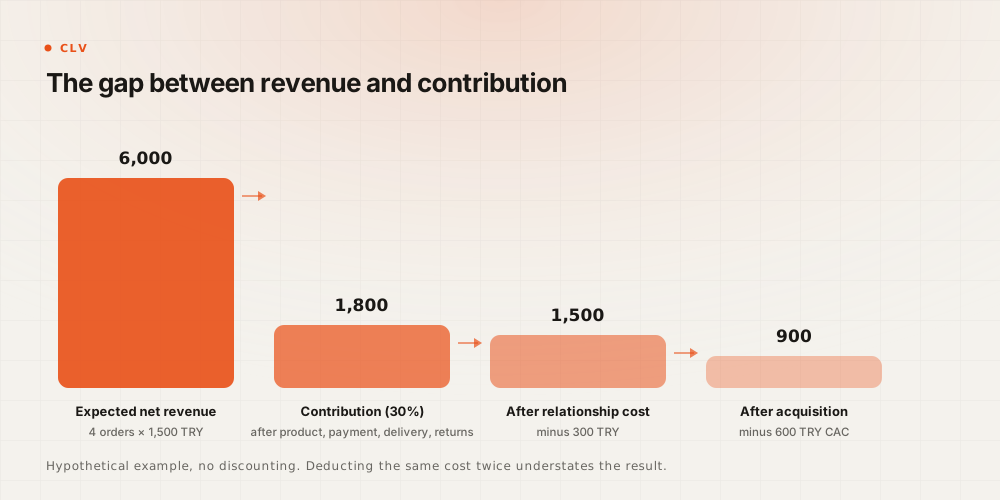
Suppose a customer is expected to place four orders over the next 12 months, generating 1,500 TRY net revenue per order. After product, payment, delivery and expected return costs, assume a contribution rate of 30%. Assume a customer relationship cost of 300 TRY not yet included in that contribution, and an acquisition cost of 600 TRY.
| Calculation | Result |
|---|---|
| Expected net revenue: 4 × 1,500 TRY | 6,000 TRY |
| Contribution before relationship cost: 6,000 TRY × 30% | 1,800 TRY |
| Contribution after relationship cost: 1,800 − 300 TRY | 1,500 TRY |
| Contribution after acquisition cost: 1,500 − 600 TRY | 900 TRY |
No discounting has been applied in this illustrative example and every input is hypothetical. For a real decision, a downside scenario for the order, margin and retention assumptions should be calculated as well. Deducting the same cost both inside the contribution rate and again as a separate expense understates the result.
What do the BG/NBD and Gamma-Gamma models provide?
BG/NBD can be used to model future transaction counts in non-contractual settings where churn is not directly observed. Gamma-Gamma helps estimate the expected monetary value per transaction under appropriate data and assumptions. Combining these outputs can produce a revenue forecast for the chosen period; a profit calculation needs a separate cost and margin layer. PyMC-Marketing CLV guide.
The Gamma-Gamma approach carries assumptions such as the independence of average transaction value from the purchase process across customers. Amounts that go negative because of returns, or spend strongly correlated with transaction frequency, can make the application problematic. Data and assumptions should be examined before choosing a model. PyMC-Marketing Gamma-Gamma explanation.
There is one important technical distinction. In classic RFM, recency is the time from the last purchase to today. In BG/NBD implementations the same name can mean the time between the first and last purchase; the observation period and the repeat purchase count are also used. Carrying inputs across just because the column names match can produce wrong results. PyMC-Marketing data definitions.
Fit the model on a past period and test it on a later period not used in training. Question the implementation cost of a complex model that cannot beat a simple customer-cohort average. In business models where subscription cancellation is directly observable, retention or survival models suited to the contract structure should be considered.
A high CLV estimate does not mean every marketing expense directed at that customer will produce a high return. The customer may buy anyway. The decision to invest further should be tested against the incremental contribution the intervention creates.
Rule-based segmentation or machine learning?
A rule-based approach can be enough where the conditions are explicit, the data is limited and the implementation is simple. Clustering earns its keep when you need to discover relationships among many observations and features. The two approaches can also be used in the same project: research and clustering surface candidate groups, then explainable rules are developed for the implementation.
| Method | When it can be considered | Core limitation |
|---|---|---|
| Business rules | A small number of clear decisions and understandable thresholds | Unreviewed rules can perpetuate outdated assumptions |
| K-means | Discovering groups in numeric, appropriately scaled features | Sensitive to cluster count, outliers and cluster shapes |
| Hierarchical clustering | Examining parent and child relationships between groups | Computation and memory cost rise on large datasets |
| DBSCAN / HDBSCAN | When density structure and unusual observations are meaningful | Distance, parameter and variable-density choices drive the result |
| Predictive models | When purchase, churn or value probability is required | The transferability of past patterns to the future must be tested |
Clustering options carry different assumptions and different evaluation methods. Measures such as the silhouette score help assess geometric separation; they do not prove a segment's commercial value. scikit-learn clustering documentation.
Feature selection directly affects the result. Many columns representing the same behaviour can over-weight that behaviour. Scale, missing data, outliers and customer tenure should all be controlled. Assigning arbitrary numbers to categorical variables can create a distance relationship that does not really exist.
After the technical assessment, three business questions should be asked: can the team explain this group? Is there a different decision for it? Can new customers be assigned to it reliably? Clusters that do not represent similar needs across periods, or that change daily for no reason, make operations harder.
B2B segmentation: company, opportunity and decision-maker
In B2B, different people inside the same organisation can have diverging needs and decision authority. It is therefore useful to assess company fit, the live buying opportunity and the stakeholders' questions separately. Squeezing all three into a single "target persona" record can lose the detail a sales team needs.
The differences between B2C and B2B should not be treated as rigid templates. Buying a home or a car can require a long B2C research process; a low-value B2B subscription can be bought quickly. Decision speed, stakeholder count, risk and implementation difficulty should be researched at product level.
Layered analysis in B2B
Shapiro and Bonoma's work on industrial market segmentation is a methodological source dating from 1984. How to Segment Industrial Markets.
The layered approach in that literature can be applied in a current B2B project with the following questions:
| Analysis layer | Example questions |
|---|---|
| Company attributes | Which sector, which size and which geography does it operate in? |
| Operations and technology | Which systems does it use; what are the integration and usage needs? |
| Buying pattern | Who holds the budget; how are suppliers chosen; how do approvals proceed? |
| Opportunity context | Why now; for which use; what size of purchase is planned? |
| Stakeholder decision conditions | Which business outcome are they accountable for; which risk and which evidence matter to them? |
In the final layer, recording business criteria validated in interviews is sounder than guessing at personality labels. "Will not accept the risk of a service outage during migration" gives actionable information; "an executive resistant to innovation" does not.
Example: selling software to multi-branch businesses
Suppose a hypothetical software company offers inventory and order management across branches. Instead of targeting only "retailers with more than 50 employees", it can examine the multi-branch structure, the inventory visibility problem, compatibility with existing systems and the need to change within a certain period, all together.
| Stakeholder | Priority question | Evidence or content that can be offered |
|---|---|---|
| Operations manager | Will errors and workload between branches fall? | A workflow example and pilot success criteria |
| Finance or economic buyer | What are the total cost and payback terms? | A cost and benefit calculation with explicit assumptions |
| IT and security | How will it work with our systems, how is data managed? | Integration documentation, access and security explanations |
| Daily user | How hard is the new system to learn and use? | A task-based demo, training and support plan |
| Procurement or legal | Are the contract and supplier terms acceptable? | Service scope, responsibilities, contract information |
These five roles need not be five separate people at every company. In a small business the roles can merge; in a large organisation there can be additional approvals. During the sales process, track which role is not yet represented and which question remains unanswered.
Separating fit from intent
A company can be a good fit for the solution but not yet in a buying window. Another company consuming a lot of content may have a structure that cannot technically be served. Fit, intent and opportunity stage should be held in separate CRM fields.
Third-party intent data can create research priority; on its own it does not confirm that a budget, a project or a buying committee exists. Do not read a company-level signal as one particular employee's personal intent. Use it as a hypothesis to be validated in the sales conversation.
The segment card that carries segments into practice
The segment card connects research to daily work. Each core segment's definition, evidence, planned implementation and owner should sit in the same place. Uncertainties about the need should not be erased from the card.
| Field | What the card should contain |
|---|---|
| Name and unit of analysis | Which customer, company, opportunity or purchase situation is described? |
| Core need | Which outcome does the customer want to achieve? |
| Trigger and stage | Which event surfaces the need; which decision is pending? |
| Assignment condition | Which statement or observation determines membership? |
| Evidence and uncertainty | Sources, recency, counter-examples and gaps |
| Commercial conditions | Reachable size, contribution, cost and service limits |
| Objection and decision criteria | What stops the customer from moving forward? |
| Value proposition and evidence | Which promise is supported by which real information? |
| Implementation | What changes in product, content, sales, CRM or advertising? |
| Measurement and ownership | Core metric, comparison, owner and review date |
A short filled-in example
In a hypothetical segment called "those seeking assurance on first use", the need may be to complete installation and first use without error. The entry signal is the customer stating that priority in a short needs form; visiting support content is held as a supporting observation. For people who only visit and state nothing, assignment confidence is lower.
In this segment the content team can develop a step-by-step usage guide, the product team an installation explanation, and the CRM team a well-timed support flow. The core metric can be contribution per customer over the chosen period; supporting metrics can be returns, support load and second purchase. The campaign owner and the product knowledge owner are different people, and both are named on the card.
Which fields should be held in systems?
The minimum record should include segment ID, need label, assignment source, last update, model or rule version and, where applicable, a validity period. Communication consent and channel preferences are separate fields; they are not derived from segment membership. If a person has more than one need, campaign priority and contact frequency rules are defined separately.
Audiences in analytics systems are a reachable or measurable representation of strategic segments. In GA4, audience conditions can be built from event, dimension, metric and time rules; membership and exclusion behaviour are part of the design too. Google Analytics audience documentation.
How is advertising automation changing segmentation's role?
Advertising systems can increasingly model who is shown what, and when. But the business still has to define the valuable conversion, describe its product accurately and manage data quality. Optimising faster towards the wrong conversion goal does not solve a commercial problem.
In Google Performance Max, audience signals are audience suggestions that steer the algorithm. Google states explicitly that the campaign can also show ads to relevant users outside those signals. Adding a signal therefore does not mean only that strategic segment is being reached. Google Ads, Performance Max audience signals.
Segmentation contributes to advertising implementation in these areas:
- Developing messages and creative descriptions suited to the customer's need.
- Presenting the relevant decision criteria and evidence on the landing page.
- Shaping the offer around the product's usage context.
- Supplying appropriate signals from consented, current customer data.
- Defining business outcomes such as qualified opportunities or contribution alongside form counts.
Opening a separate campaign or asset group for every segment is not mandatory. Separation can be considered where there is a need for separate budget control, different product economics, a service condition or a genuine experiment. Fragmenting the account structure simply because research gave a group a different name can raise operational load and complicate measurement.
GA4's predictive metrics are not automatically available in every property either. Google requires quality conditions along with enough positive and negative examples for modelling. For instance, within a seven-day window in the last 28 days, at least 1,000 returning users must have met the relevant condition and at least 1,000 must not have. That is not a minimum customer count for segmentation in general. GA4 predictive metrics requirements.
Segmentation with SI and the use of synthetic personas
Large language models can help organise themes across interviews, reviews and support tickets, develop research questions and produce message alternatives. When the task and the acceptance criteria are clearly defined, reviewing the output becomes easier.
For example, a support ticket can be asked to yield "need, trigger, objection, product and evidence statement". The model must leave information absent from the source as "unknown" and tie every extraction to the relevant record. A sample chosen by the team should be reviewed by a person to examine mislabels and missed themes.
A workable flow consists of records stripped of unnecessary personal information, a coding dictionary explained with examples, model output matched to its source, and human review. When new labels are added to the dictionary, consistency with past records should be preserved. Text written by customers should be treated as data to be analysed by the model.
What do synthetic responses prove?
A synthetic persona is a model playing a particular customer role. It can be used to explore gaps in a concept or possible objections. But a thousand generated responses do not mean a thousand real customers were interviewed; market size and demand rates should not be calculated directly from those outputs.
The preprint by Maier and colleagues on personal-care surveys reports that a particular method can achieve similarity to human response distributions. The test-retest comparisons in that study do not amount to predicting customers' actual purchase behaviour at the same rate. The findings should be assessed in the context of the task, data and method. Maier et al., 2025, v3.
Wang and colleagues' research likewise addresses the importance of calibration with human data. This guide's recommendation is to use SI for hypothesis development and analysis support, and to test segment selection and commercial demand decisions against human research and observed behaviour. Wang et al., 2026, v3.
Segmentation in SEO, GEO and agent-led commerce
A customer's question can reveal their need and their decision context at once. "CRM software" is a broad area of interest. "A CRM for a distributed sales team that works with our existing accounting system and installs quickly" contains usage conditions, integration and implementation priority.
Those details are valuable for content planning. The customer language learned in research helps determine which topics need explaining in search engines and in generative SI answers. There is no need to infer age, income or personality from a single query.
From segment to a question and content map
| Need or context | Example customer question | What the content must supply |
|---|---|---|
| Fast implementation | "Which solution can a small team set up quickly?" | Setup steps, prerequisites, factors that affect real timelines |
| Cost control | "Which costs arise beyond the licence?" | A total cost calculation with an explicit scope |
| Technical fit | "How does it integrate with the system we use?" | Verified integration information and limitations |
| Reducing the risk of a wrong choice | "Which use is this product not suitable for?" | Suitability, sizing, capacity and usage limits |
| Continuity | "How do we manage service interruption during migration?" | Migration plan, responsibilities and support terms |
This question set can be fed by interviews, sales questions, on-site search and support records. Questions produced by the team should be marked as hypotheses. A researcher's question list is not a dataset showing users' real query volume.
Rather than multiplying content for keyword matching alone, define each page's job in the decision. A comparison table can explain which option suits which condition. A case study can show the method used, the starting position and the measurement limits. A current product page can reduce uncertainty about price, stock, scope and usage conditions.
How should SI visibility be interpreted?
GEO is concerned with the findability of a brand and its content inside generative answer systems. Google states that existing SEO fundamentals apply to AI Overviews and AI Mode, and that no special SI file or separate schema type is required. Indexability, trustworthiness and consistency between visible text and structured data are the core work. That readiness does not guarantee appearance. Google Search Central, AI features and your website.
For visibility measurement, record the tracked questions, language, geography, system, date and evaluation rule. Being mentioned, being cited with a link and appearing in a recommendation context are different events. Repeated measurements should keep the same definitions.
For example, if the brand is mentioned in 24 of 100 valid answers on a fixed question panel, that is a 24% mention rate on that panel. It cannot be presented as market share among all SI users or as 24% of total demand. Question selection and answer variability set the scope of the measurement.
Pew Research Center's 2025 US study observed that in Google searches with an SI summary, clicks to traditional result links were 8%, compared with 15% where no summary appeared. This is an observational finding based on the browsing data of 900 US adults; it is not a measured rate for other markets, nor proof of causation on its own. It does still show the limits of judging visibility only by clicks to the site. Pew Research Center, 22 July 2025.
What changes in agent-led commerce?
An SI agent can take part in research, comparison or transaction steps under conditions set by the customer. The end customer's need persists; the interaction format between them changes. Rather than treating "people who use SI" as a need segment on its own, it is more explanatory to track SI usage as a separate attribute of the decision channel.
The Universal Commerce Protocol that Google introduced in January 2026 offers a technical framework for interoperability between commerce systems and agents. Developments like this raise the question of managing catalogue accuracy, delivery, returns and transaction terms in a form systems can understand. Google Developers, UCP technical explanation.
For a business, the first step is to explain consistently what the product is suitable for and under which conditions it can be bought. Wrong stock, missing dimensions or contradictory delivery information make the decision harder for a human customer and for an agent-mediated process alike. Investment in new protocols should be planned against supported markets, transaction permissions and real customer demand.
Webtures Insights covers related ground in how agentic commerce protocols work together and how return and trust signals affect visibility in SI shopping.
Data privacy and consent management
A segmentation design must explain which data is needed and why. A customer sharing information in a preference form, commonly called zero-party data, does not mean that information can be used for every purpose. A stated preference can also change over time or be incomplete.
First-party data is data a business collects directly from its customer interactions. Holding that data and being able to use it for a specific analysis, personalisation or advertising purpose are separate assessments. In Türkiye, the data protection authority's official explanation covers the conditions for processing and the requirement to assess an appropriate legal basis for each activity. KVKK, conditions for processing personal data.
Customers must be provided with information such as the identity of the data controller, the purpose of processing, transfers, the collection method and the legal basis. The disclosure obligation is assessed independently of whether processing rests on explicit consent or another legal condition. KVKK, disclosure obligation.
Examining the data flow when choosing tools
If personal data is transferred to a CRM, analytics, advertising or SI tool, where it goes and who processes it must be established. In Türkiye, the changes that took effect on 1 June 2024 introduced a framework covering adequacy, appropriate safeguards and certain incidental situations for transfers abroad. A regular data flow should not be assumed to be covered by a generic consent box; the appropriate transfer mechanism has to be assessed for the concrete flow. KVKK, transfers abroad.
In practice, unnecessary personal fields should be removed from the analysis set, access limited to the role, and retention periods defined. Segment labels themselves can carry personal information. Building a marketing label by inferring health, political opinion or similar sensitive attributes from behaviour requires separate legal and platform-policy assessment.
Advertising products such as Google Customer Match also have their own policies on data source, required consent and sensitive categories. Being technically able to upload a list does not show the use is appropriate in every circumstance. Google Customer Match policy.
How should cookie changes be handled?
"Third-party cookies have ended completely in all browsers" is not an accurate planning assumption. In its 22 April 2025 statement, Google said it would maintain the current user-choice approach in Chrome and would not introduce a new, separate cookie prompt. Google Privacy Sandbox statement.
A data strategy's rationale should not hang on a single calendar change. Consented customer relationships, consistent measurement and quality product data are valuable under different technology conditions too. Not every business needs to build a CDP or a data clean room at the outset; additional investment is assessed when a concrete need emerges that the existing CRM, order records and analytics cannot solve.
How is the success of segmentation measured?
One segment converting better than another does not show that segmentation produced more sales. The groups may have had different propensities to buy in the first place. The valuable question is how much additional result the chosen intervention produced compared with the existing approach.
Choose the core metric first
| Implementation | Example core result | Balancing metric to track alongside |
|---|---|---|
| New customer campaign | Contribution per new customer after acquisition cost | Returns, cancellations, payment problems |
| Repeat purchase | Period contribution per customer | Unsubscribes, discount cost |
| B2B demand generation | Sales-accepted qualified opportunities and later contribution | Low-quality enquiries, sales workload |
| Product adoption | Occurrence of defined value-creating usage | Support load, errors, churn |
| Content and SI visibility | Visibility on relevant decision questions and qualified demand | Wrong information, irrelevant visibility, low demand quality |
ROAS expresses revenue attributed relative to ad spend; CAC expresses the ratio of defined acquisition cost to new customers. Their scopes are not the same. In B2B, a CAC that includes only advertising cost should not be compared side by side with one that also covers sales team costs. Period and value definitions must be consistent in the CLV-to-CAC ratio too.
If NPS is used, likelihood to recommend is asked on a 0-10 scale; the percentage of those scoring 0-6 is subtracted from the percentage scoring 9-10. how to measure NPS. In B2B the responses of different roles can be examined separately; it is not correct to call NPS a weighted "account health" score automatically. Account health, composed of usage, contract, support and stakeholder engagement, has to be defined separately.
Build comparable groups inside the segment
In a sound experiment design, customers inside a predefined segment are randomly assigned to test and control groups. The test group receives the new intervention, the control group the defined existing approach. Comparing the groups helps assess which intervention created additional value.
For the question "Is a segmented message better than a general one?", the control should receive the general message. For "Is running this campaign better than not running it?", the appropriate control receives no campaign. The definition of the control is the definition of the effect being measured.
The unit of assignment matters too. Assigning people at the same B2B account to different groups can contaminate the groups through internal information sharing. If assignment at account, household or geography level is needed, the design and the statistical assessment must be built at that unit.
An example calculating incremental contribution
In the hypothetical test below, eligible customers were randomly assigned to two groups in advance. Contribution is calculated after product, delivery, payment and return effects, without deducting the incremental cost specific to the test.
| Metric | Test group | Control group |
|---|---|---|
| Customers assigned | 5,000 | 5,000 |
| Period contribution per customer | 46 TRY | 40 TRY |
| Total period contribution | 230,000 TRY | 200,000 TRY |
The observed difference in contribution per customer is 6 TRY. For the 5,000 people in the test group, estimated incremental contribution is 30,000 TRY. If the additional cost specific to the test intervention, and not already included in the contribution calculation, is 20,000 TRY, the observed net incremental contribution is 10,000 TRY.
This arithmetic does not by itself show statistical certainty. The distribution of customer contributions, the uncertainty interval, the pre-experiment design and possible group contamination all need examining. When a small difference is observed, no scaling decision should be made without knowing how variable the result is.
If the group sizes are unequal, raw totals should not be subtracted directly. For conversion, first calculate converted customers / assigned customers. Relative lift, while the control rate is above zero, is found with (test rate − control rate) / control rate. The absolute percentage-point difference should be reported as well.
Preventing the errors that weaken measurement
There is no fixed control-group percentage that suits every business. The required sample depends on the baseline conversion, the difference you want to detect, measurement variability, the unit of assignment and the uncertainty you accept. The duration must also cover the purchase and return cycles.
Stopping on a day the test looks good, or picking the best-performing sub-group afterwards, can mislead. The main hypothesis, metric, period and decision rule should be written in advance. New segment hypotheses generated after an experiment should be tested in a separate validation study.
The same message producing similar results in two segments does not prove segments are unnecessary for all decisions. Assess the adequacy of the test and the intervention examined first. If no meaningful distinction is found in product, service and communication decisions either, merging the groups can be considered.
End-to-end example: segmentation for the second purchase
Suppose a hypothetical home and living brand wants to increase repeat purchase after the first order. At the outset, every customer receives the same discount email. To improve contribution and customer experience together, the team can design the following work.
Research: Order, return and support records are merged; interviews are held with customers who bought once and did not come back. Three need hypotheses emerge: those who want support on first use, those looking for complements compatible with the product they own, and those who have not yet identified their next need. These groups' market share is not calculated from the interview count.
Assignment: The purchased product category, the customer's answer to a short preference question and suitable behavioural records are used. People with insufficient information are held separately. Communication consent is checked independently of the need label.
Implementation: The first group receives a usage guide, the second a description of complementary products with verified compatibility. For the third group, product care content or a lower contact frequency can be tried. All of these are options to be tested; their outcomes are not known in advance.
Experiment: In every group with sufficient volume, the new approach is compared with the existing communication. If the aim is to evaluate the segmented experience, the elements changed during the test and the offer costs are recorded explicitly. The core metric is 90-day contribution per customer; supporting metrics are second purchase, returns, support load and unsubscribes.
Decision: If guide content improves contribution without creating excessive discount cost, it can be extended. Where a group's result is unclear, data quality, hypothesis and sample are examined. An intervention that only increases clicks while reducing contribution is not reported as a commercial success.
An implementation plan for the first 90 days
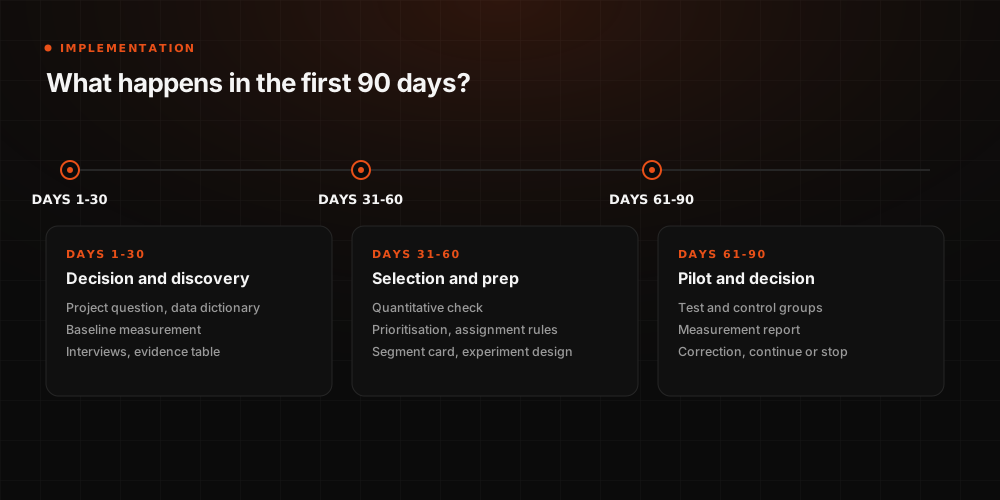
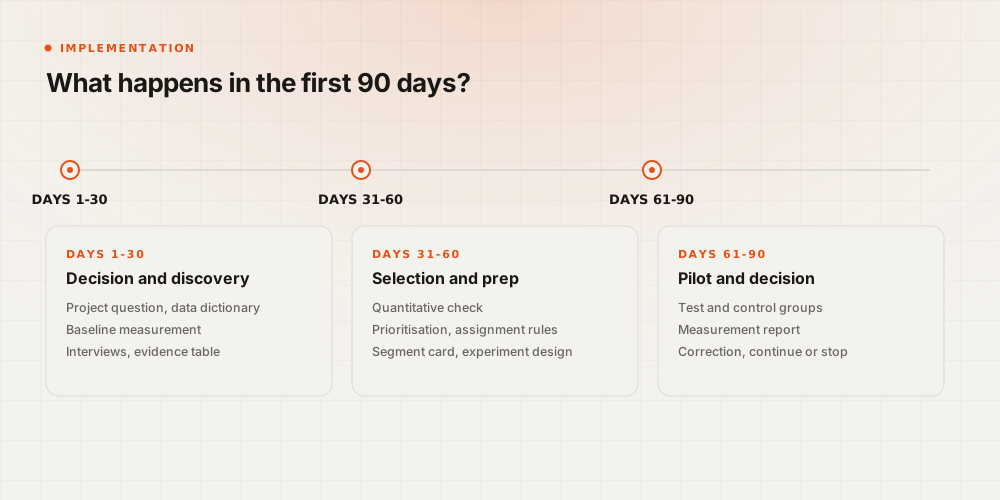
This timetable is for a first project of limited scope. Data access, customer interviews or a long sales cycle can require more time. In B2B especially, the end of 90 days may bring solid research and a running experiment rather than a revenue effect.
| Period | Priority work | Concrete output | Responsible function |
|---|---|---|---|
| Days 1-15 | Decision, data definitions and access | Project question, data dictionary, baseline measurement | Business owner, data and the relevant legal/compliance team |
| Days 16-30 | Interviews and need discovery | Evidence table, segment hypotheses | Research, sales and customer experience |
| Days 31-45 | Quantitative check and prioritisation | Selected segments, uncertainties, assignment rules | Analytics, marketing and product |
| Days 46-60 | Implementation preparation | Segment cards, content and offer, experiment design | Channel owners, product and sales |
| Days 61-90 | Pilot and first assessment | Measurement report, correction and continuation decision | Business owner and analytics |
Daily behaviour labels can be refreshed often; the definitions of core need segments can be reviewed less frequently. A quarterly review can serve as a starting rhythm. A product change, a new market, a pricing policy or repeated customer complaints may require an earlier examination.
Record which rule changed and why for each version. That way, a change in past performance can be investigated as coming from the campaign, from customer behaviour, or from the segment definition itself.
The most common segmentation mistakes
| Mistake | Consequence | A sounder approach |
|---|---|---|
| Collecting data before defining the business decision | Unused reports and unclear scope | Write the decision, the owner and the success measure at the start |
| Producing only demographic profiles | Classes that do not change the message | Research need, context and objections |
| Treating existing customers as the whole market | Missing new demand and lost buyers | Include non-customers in appropriate research |
| Creating many micro segments | Production, media and measurement complexity | Show the decision each split changes |
| Counting high revenue as high profit | Over-prioritising costly customers | Examine returns, service and acquisition costs |
| Counting synthetic responses as real customer data | Weakly grounded demand estimates | Use synthetic output as a hypothesis |
| Equating a platform audience with a strategic segment | Misreading reach and results | Separate assignment, reach and measurement scope |
| Counting a segment difference as campaign effect | Unnecessary investment in customers who would buy anyway | Set up a proper control inside the same segment |
| Treating labels as correct indefinitely | Outdated communication and offers | Manage source, date and version |
To see whether a segmentation is usable, put a short question to the team: "If this segment were removed tomorrow, which decision of ours would change?" If there is no clear answer, the definition or the purpose needs rethinking.
Frequently asked questions
Are audience segmentation and customer segmentation the same thing?
Audience work can also cover potential buyers and groups that influence the decision. Customer segmentation focuses on the existing customer base. When entering a new market, working only with customer data may not be enough.
How many segments should be created?
There is no universal number. Starting with a few core segments in the first implementation makes it easier to produce and measure different experiences. Every additional segment needs a separate decision, sufficient evidence and implementation capacity.
Can small businesses segment without SI or a CDP?
Yes. You can start with explainable rules built on order records, customer interviews and a simple CRM. New technology is assessed when a data-joining, speed or scale need emerges that the current method cannot solve.
Is RFM enough on its own?
It can be useful for organising repeat purchase behaviour. But it does not explain the need, a new customer's potential or the full cost to serve. Depending on the business decision, it should be complemented with interview data, product usage and contribution analysis.
Is K-means the best segmentation method?
A method's suitability depends on the data type and the objective. Clustering may not be needed for a problem that clear business rules can solve. Clusters that separate well technically must also be understandable and actionable.
Can SI replace customer interviews?
SI can support research design, thematic analysis and scenario generation. It does not by itself validate the context a real customer lives in or the commercial demand. Decisions should be tested against human data and observed results.
Does every segment need its own advertising campaign?
No. A separate campaign can be considered when there is a need for separate budget or control. In many cases developing a different message, product description or landing experience within the same structure is enough; the distribution behaviour of the platform in use should also be taken into account.
Does a high mention rate in SI search mean more sales?
No such conclusion can be drawn directly. What matters is which questions the mention occurred on, in which context, and for which customer need. Visibility measurement should be assessed alongside qualified demand, customer feedback and business results.
How often should segments be updated?
Behaviour and lifecycle labels can be refreshed often, depending on the purpose. Core need definitions are reviewed through regular research. The rhythm of change is set by the product's purchase cycle, the data flow and how fast the market moves.
Tying segmentation to the company's decisions
To begin, choose a single business decision, research the customer need that affects it, and test a different approach in a small implementation. When the segment card holds evidence, assignment rule, owner and measurement together, research becomes part of daily work. The next investment can then rest on which implementation produced verifiable value, rather than on which group looked most interesting.
To set up the measurement on the segment card and track contribution by channel, see the SI and agentic analytics page. To connect the customer questions that emerge from your segments with visibility in search and generative answer systems, the GEO service page helps. The full scope sits on the services page.