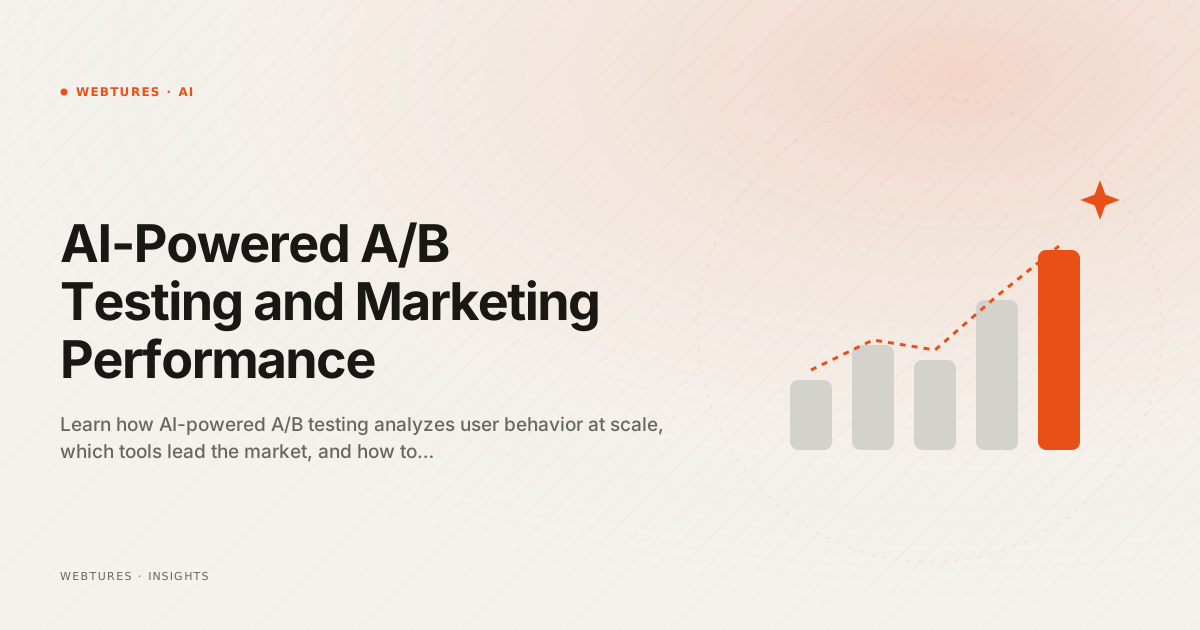
AI-Powered A/B Testing and Marketing Performance
Learn how AI-powered A/B testing analyzes user behavior at scale, which tools lead the market, and how to lift marketing performance in real time.
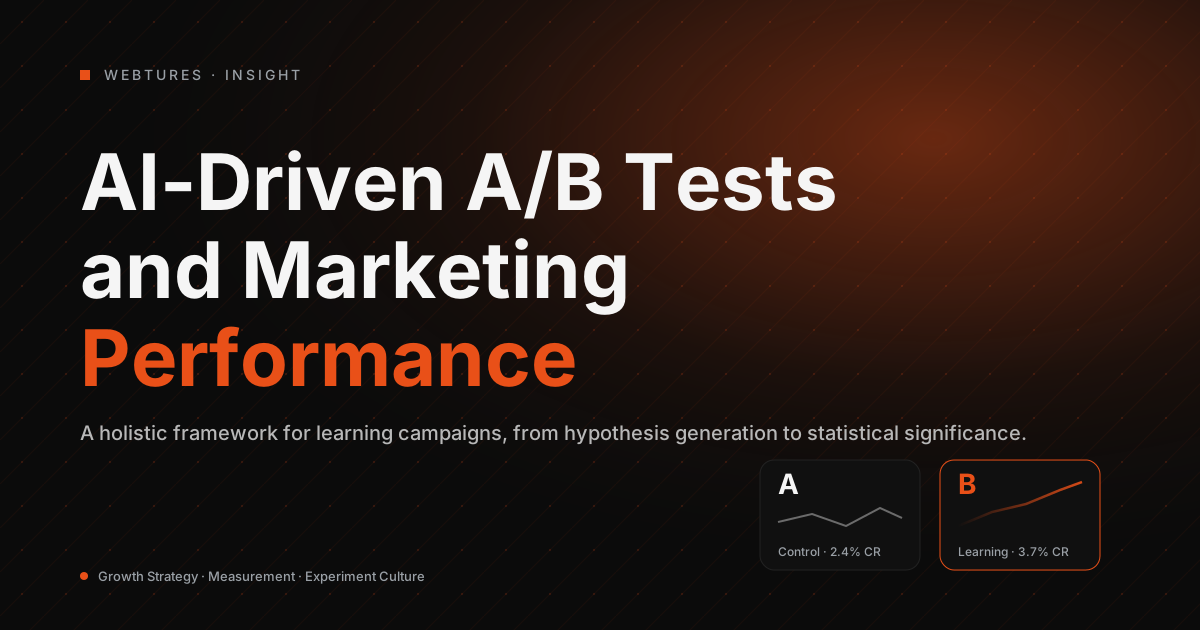
AI-powered A/B testing evaluates two or more variants by adding a machine learning layer on top of classical statistical testing. In a classical A/B test, traffic is split at a fixed ratio and the result is read at the end. In an AI-driven setup, the traffic split is updated while the test runs, user segments are modelled separately, and the decision process is automated. This article covers how the method works, which platforms implement it, and where it is most often set up wrong.
What is AI-powered A/B testing?
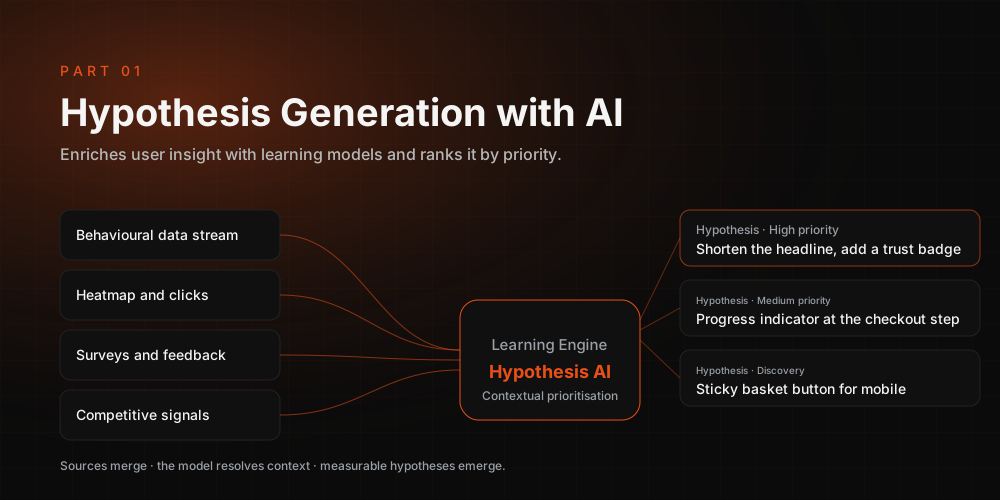
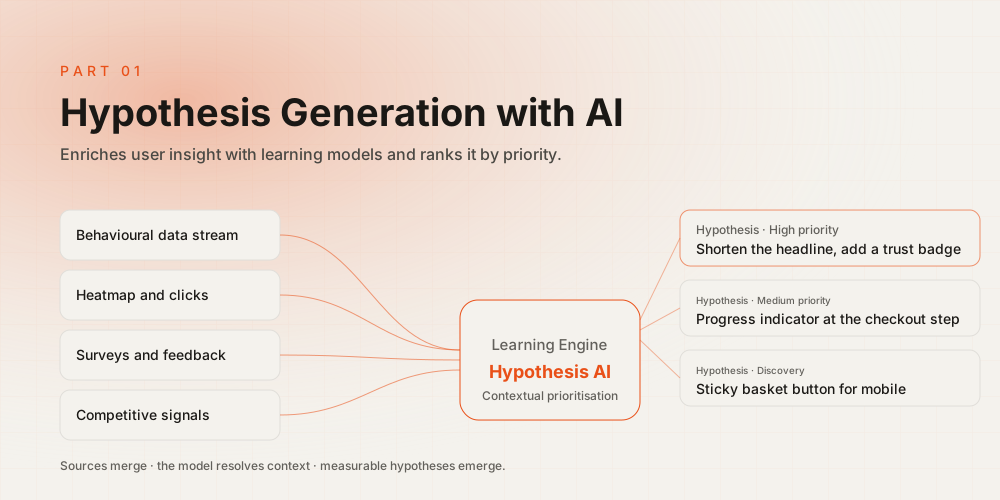

The difference lies in when and how the decision is made. A classical A/B test is planned around a fixed sample size: you write a hypothesis, calculate the required number of users up front, run the test untouched until it reaches that number, and read the result once.
An AI-driven setup changes that flow in three places:
- Traffic allocation is dynamic. The leading variant receives more traffic while the test is still running.
- Segmentation is automatic. The model learns separately which variant performs better in which user group.
- The decision updates continuously. Results are re-evaluated as data accumulates rather than at a single end point.
This approach is not superior in every scenario. On low-traffic pages, or for strategic decisions where you need a clean learning, a classical fixed-sample test remains the more reliable choice.
How does AI make a test faster?
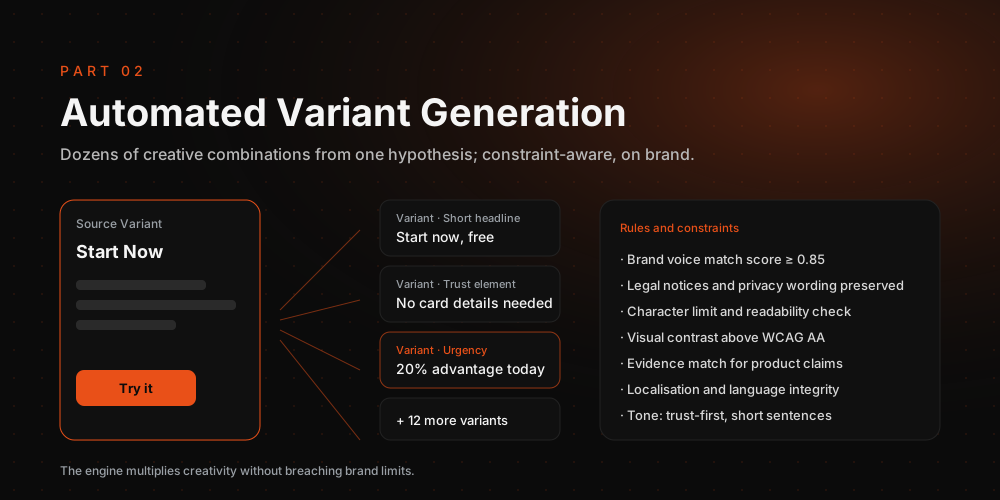
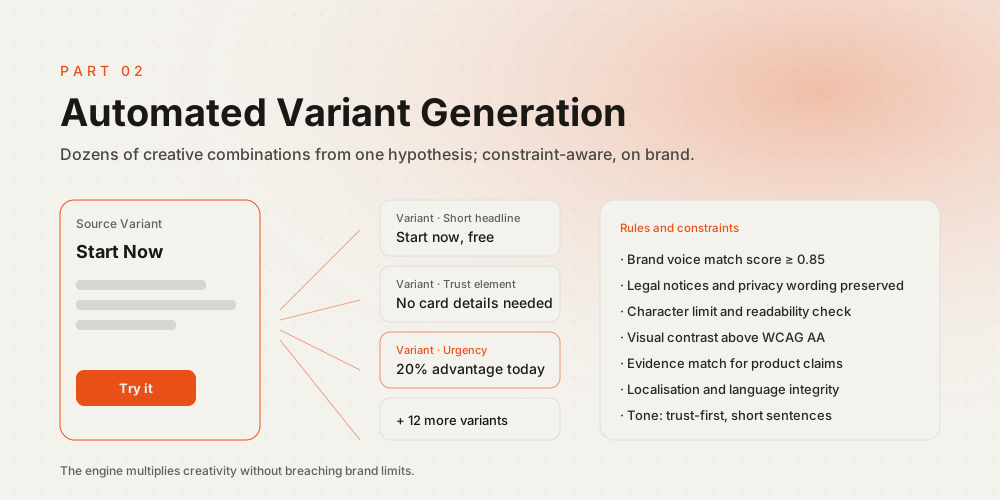
The speed gain does not come from AI overriding statistics. It comes from wasting less traffic. Three mechanisms do the work.
Multi-armed bandits
Bandit algorithms reallocate traffic based on the data collected so far instead of holding a fixed split. The underperforming variant is shown to progressively fewer users, which lowers the total cost of the test because less traffic is spent on the loser. The trade-off is real: a bandit setup does not measure the size of the gap between variants as cleanly as a classical test. It answers "which one is better," not "by how much."
Sequential testing
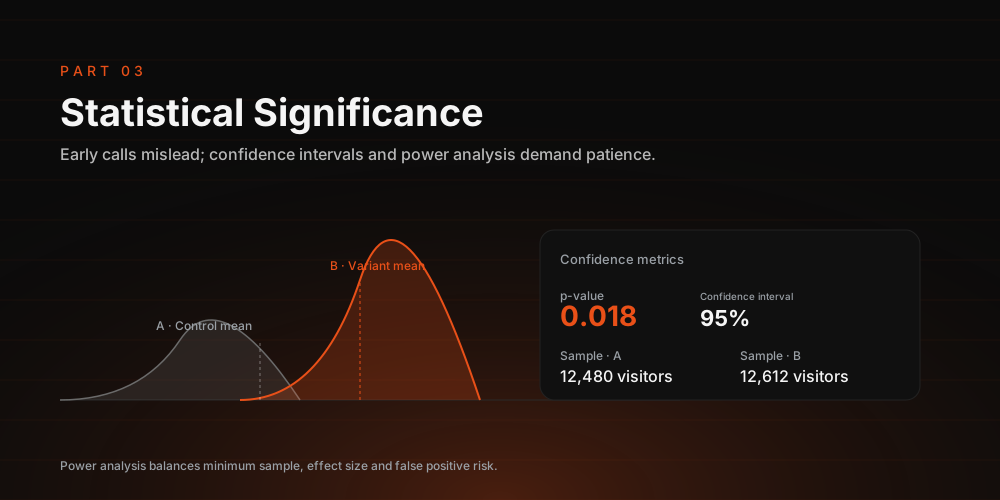
Sequential methods make it statistically legitimate to look at interim results. In a classical test, checking the data early and stopping the moment significance appears inflates the false positive rate, a problem known as peeking. Sequential methods adjust the stopping threshold to account for those interim looks. The test then ends when it is genuinely finished, not when a calendar date arrives.
Variance reduction and segment modelling
The modelling layer uses each user's pre-experiment behaviour as a covariate, which reduces noise in the measurement. Less noise means the same precision is reached with a smaller sample. The same layer surfaces differences the average hides: a variant can look neutral overall while clearly winning among mobile users.
All three share one point. AI does not remove sample size and confidence intervals from the equation; it uses the same statistical framework more efficiently. A tool that reports no interval and simply announces that "AI picked the winner" is selling the appearance of a result rather than the result.
How do you run an AI-powered A/B test?

The process starts with measurement infrastructure, not tool selection. In order:
- Pick a single primary metric. Conversion rate, add-to-cart, form completion. Secondary metrics are monitored, not decided on.
- Write a directional hypothesis. Frame it as "this change will increase this metric for this user group for this reason."
- Calculate the sample up front. Derive the required number of users from your current conversion rate, the minimum difference you want to detect, and an acceptable error rate. Skip this step and the result cannot be interpreted.
- Verify tracking. Confirm that event tracking is correctly configured before the test starts.
- Build the variants. Change several elements at once and you will know which variant won, but not why.
- Run the test. Decide whether to hold a fixed split or use a bandit. Fixed allocation optimises for learning, bandits for revenue.
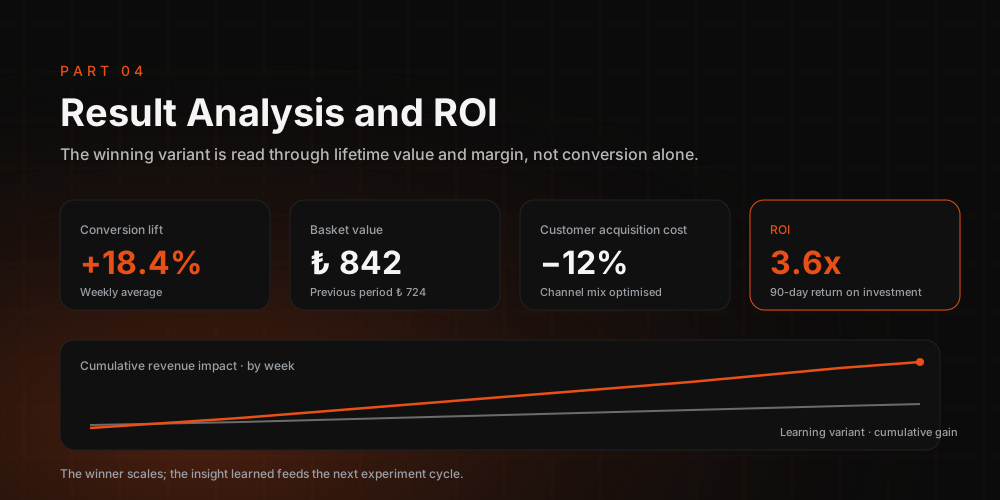
- Read the result with its confidence interval. Report the full interval and the business impact, not a single percentage.
- Ship the winner and validate it. If the lift does not repeat in production, question the setup.
Which A/B testing platforms are used?
Only a limited number of platforms handle experiment design, traffic allocation and statistical reporting end to end. On the enterprise side, these stand out:
| Platform | Where it stands out |
|---|---|
| Optimizely | Sequential statistics, server-side experimentation, broad feature flag support |
| Adobe Target | Automated targeting and personalization, integration with the Adobe data layer |
| VWO | Visual editor, combined analysis with heatmaps and session recordings |
| Dynamic Yield | Product and content recommendation optimization, ecommerce-focused personalization |
| Kameleoon | Real-time segmentation, predictive audience scoring |
Google Optimize, Google's free testing tool, was shut down in September 2023. Its functions are covered today by the platforms above; if you need a free alternative, open-source experimentation libraries or server-side feature flag infrastructure are reasonable starting points.
Where does generative AI fit in?
ChatGPT and similar generative models are not A/B testing platforms. They do not split traffic and they do not produce statistical results. They help at two points in the process: generating variants and interpreting results.
- Variant generation: useful for quickly multiplying headline, button and description alternatives. A human still has to check the output against brand voice. Our guide on creating content with AI covers this.
- Result interpretation: useful for summarising an outcome and framing the next hypothesis. The statistical decision must still rest on the interval your platform reports, not on the model's summary.
What are the most common mistakes?
Most tests are lost in setup and interpretation rather than in the statistics. The usual failures:
- Stopping early. Checking daily and cutting the test the moment significance appears produces false positives. Unless you are using a sequential method, wait for the planned sample.
- Skipping the sample calculation. Trying to detect a small difference on a low-traffic page produces tests that run for months and still resolve nothing.
- The wrong primary metric. A change that lifts click-through can depress purchases. The deciding metric should be the one closest to the business outcome.
- Ignoring novelty effects. A new design's early lift may not hold. Run the test across at least one full behavioural cycle.
- Not documenting the winner. An unrecorded test gets repeated six months later.
Most tests target on-page conversion elements. Our articles on CTA button optimization and keeping visitors on your site are a good source of hypotheses.
To design your testing programme, validate your measurement setup, or re-read existing experiment results, explore our services or get in touch with the Webtures team.
Growth & GEO