How to Optimise Whitepapers and Reports for AI Search
Learn how to optimise whitepapers and reports for AI Search by strengthening data, methodology, expertise, and citation potential.

How to Optimise Whitepapers and Reports for AI Search
Whitepapers and reports are high-value source assets that strengthen a brand’s expertise, data, methodology, and industry knowledge signals for AI Search. AI-generated answers can extract more value from sources that include original data, benchmarks, methodologies, sector analysis, and actionable insights than from surface-level blog content. For this reason, whitepapers and reports should not be seen only as PDF documents created for lead generation or brand prestige. When structured well, they help position the brand as an authority that produces knowledge, interprets data, and supports strategic decision-making in a specific field. For SEO, content, product, and growth teams, the goal is not only to publish the report or collect form submissions. The real objective is to make the report understandable, source-worthy, and usable in the right context by AI systems. A strong optimisation approach should combine an HTML summary page, PDF access, methodology explanation, data tables, chart text, schema structure, and performance measurement.
Why Whitepapers and Reports Can Become Strong Sources in AI Answers
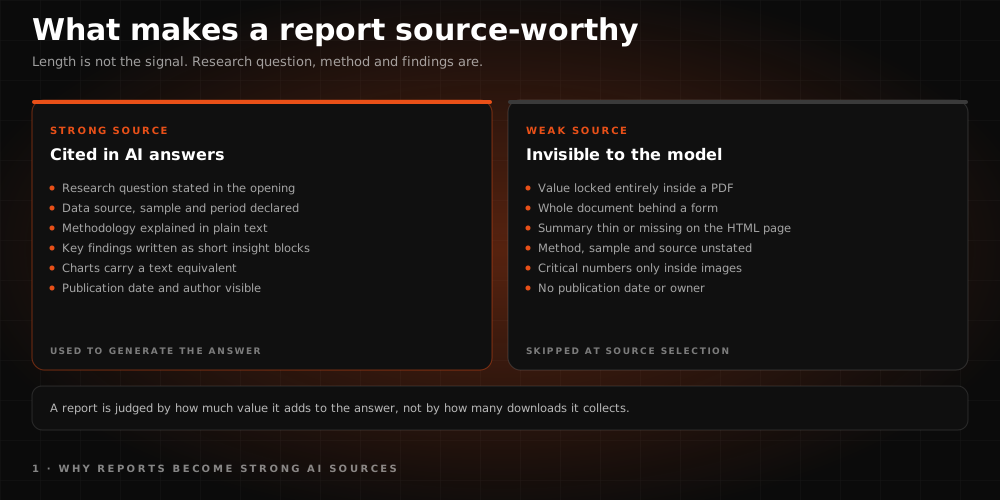
In AI search experiences, visibility is measured not only by whether the report page can be found, but also by how the information in the report is used within the answer. Users looking for strategic decisions want reliable analysis, data, methodology, industry interpretation, and actionable takeaways. Whitepapers and reports can therefore become strong source assets not simply because they are long-form content, but because they provide research questions, data sources, methodologies, and findings.
In traditional SEO, a report page was often evaluated through organic traffic, backlinks, or lead volume. In the age of AI Search, the value a report adds to answer generation also becomes important. A report with a clear methodology, accessible findings, readable chart explanations, and strong industry interpretation is more suitable for being used as a source in AI answers. In contrast, reports that are only embedded inside PDFs, fully locked behind forms, weakly summarised, or unclear in methodology may have limited AI visibility.
What Information Users Expect When They Search for Reports
Users searching for whitepapers and reports usually do not want only general information about a topic. They often look for reliable data to support decisions, build strategy, prepare internal presentations, compare markets, or justify investments. Report content should therefore be designed to address different needs based on the user’s knowledge level and decision stage.
For users in the research stage, topic summary, scope, key findings, and methodology are important. Users in the decision stage need industry breakdowns, comparative data, risks, opportunities, actionable recommendations, and an executive summary. A report page should therefore not consist only of a “download the report” call to action. It should clearly explain what the report investigates, which data it is based on, which questions it answers, and what strategic value it offers to the reader.
How to Build Trust Signals in Reports
The report topic, publisher, author, date, methodology, data source, sample, findings, and expert interpretation together create a strong expertise asset. AI systems may evaluate a report not only by its title or PDF file, but by how transparent, current, and verifiable the information is. For this reason, the data source, time period, analysis method, and any limitations should be clearly stated.
Trust signals become especially important in B2B, finance, healthcare, technology, e-commerce, and industrial sectors. Clear author information, organisational expertise, publication date, methodology explanation, current data, chart explanations, and expert commentary increase the source value of the report. In contrast, unclear chart sources, unexplained datasets, exaggerated conclusions, or outdated findings can weaken trust. Reports should therefore be transparent, balanced, and source-ready in both their data and interpretation.
How to Balance PDF, HTML Page, and Gated Access
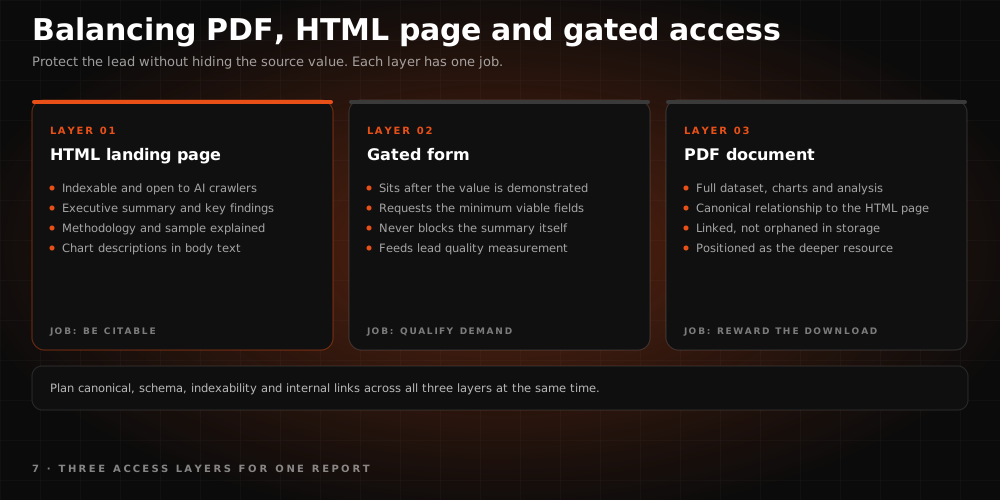
One of the most important parts of optimising whitepapers and reports for AI Search is balancing PDF access with HTML page visibility. Many brands place reports fully behind a form to collect leads. However, if no summary, methodology, or key findings are presented in an indexable way, AI systems may struggle to understand the content. Even when gated access is used, the core value of the report should be visible on the HTML landing page.
The HTML report page can include an executive summary, key findings, methodology, sample chart explanations, industry breakdowns, and the questions answered by the report. The PDF can then be positioned as the deeper resource containing detailed data, charts, and analysis. Canonical structure, schema, indexable summaries, PDF links, form usage, and internal linking should be planned together. The goal is to protect lead generation value without making the report’s AI Search source value completely inaccessible.
What Sections Should a Whitepaper or Report Page Include?
A whitepaper or report page should not consist only of a short description, cover image, and download form. The page should include sections that clearly communicate the value of the report to both users and AI systems. Executive summary, data tables, chart explanations, methodology, short insight blocks, industry breakdowns, and actionable recommendations are core elements of this structure.
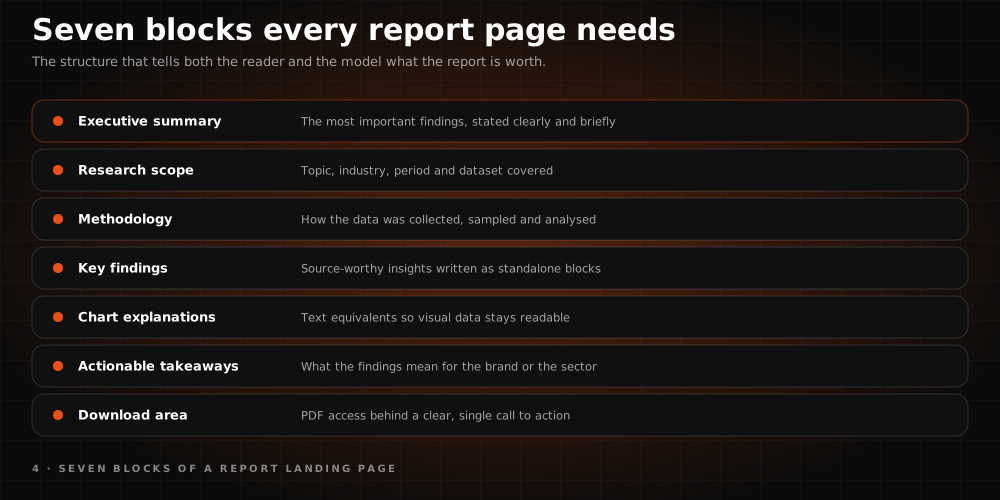
Key sections may include:
- Executive summary: Explains the most important findings clearly and concisely.
- Research scope: Shows which topic, industry, period, or dataset the report covers.
- Methodology section: Explains how the data was collected and analysed.
- Key findings: Presents clear, source-worthy insights that can be used in AI answers.
- Chart and table explanations: Improves accessibility by providing text equivalents for visual data.
- Actionable takeaways: Explains what the findings mean for the brand, industry, or user.
- Report download area: Provides PDF access with a clear CTA.
This structure strengthens both the user experience and the AI Search visibility of the report.
What Information Should Be Visible in a Report for AI Search?
The structure below shows which information should be visible on a whitepaper or report page. The goal is not only to publish the report, but to structure it in a way that AI systems can understand, use as a source, and connect to user needs.
How to Measure Whitepaper and Report Performance
Whitepaper and report performance should not be measured only through download numbers or form submissions. In the age of AI Search, teams should also monitor whether these assets are used as sources, which queries they appear in, which findings are carried into answers, and how they contribute to brand authority. Measurement should therefore include both classic lead metrics and AI visibility indicators.
On the traditional side, teams can track report landing page traffic, form conversion rate, PDF downloads, backlink acquisition, referral traffic, page engagement, and post-conversion lead quality. On the AI side, target prompt sets should be run regularly to analyse which answers use the report as a source, which findings are highlighted, how the report is compared with competitor reports, and whether the answers contain accurate information. This makes it possible to measure the report not only as a lead-generation asset, but also as a visibility, trust, and authority asset.
Common Mistakes in Whitepapers and Reports
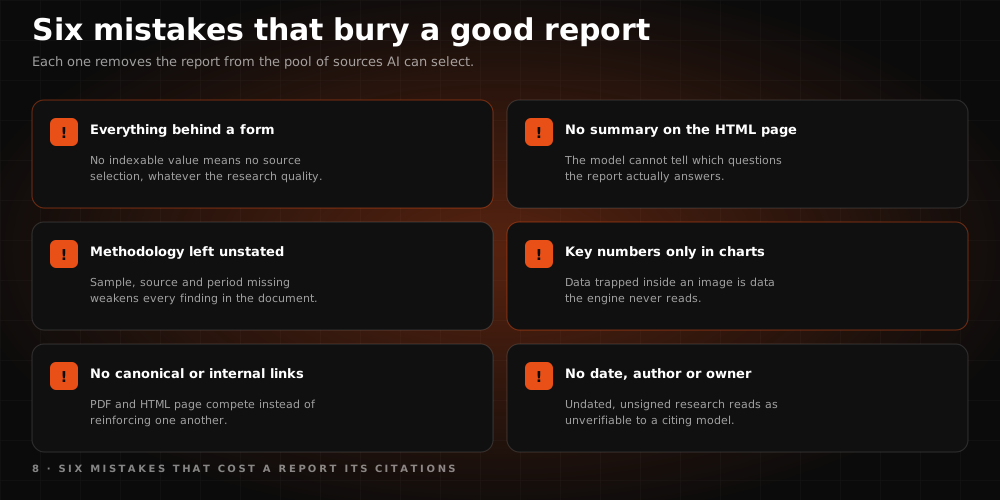
One of the most common mistakes in whitepapers and reports is locking the entire content inside a PDF and providing too little context on the HTML page. In this case, users cannot understand the value of the report before downloading it, and AI systems may not clearly understand which questions the report answers. Reports without methodology explanations, unclear chart sources, or overly bold claims can also weaken trust signals.
Common mistakes include:
- Locking the entire report behind a form
- Not including an executive summary or key findings on the HTML page
- Failing to explain methodology, sample, or data source
- Presenting critical information only inside charts
- Not planning canonical and internal link relationships between the PDF and HTML page
- Not showing publication date, author, or organisation information clearly
- Not tracking AI visibility after publishing the report
Avoiding these mistakes helps reports be evaluated as more reliable sources by both users and AI systems.
An Actionable Optimisation Plan for Whitepapers and Reports
First, the existing whitepaper and report inventory should be mapped. Each report should be evaluated by topic, date, data source, methodology, target persona, download performance, and AI visibility potential. This analysis shows which reports remain only as PDFs, which need stronger HTML summary pages, and which assets should be updated.
In the second stage, the report landing page should be strengthened. Executive summary, methodology, key findings, chart explanations, expert interpretation, and PDF access should be made visible. In the third stage, schema, canonical structure, internal linking, PDF access, and indexability should be checked. In the fourth stage, the findings in the report should be repurposed into blog posts, social media content, webinars, sales presentations, and PR assets. In the final stage, AI prompt monitoring, citation visibility, backlink acquisition, lead quality, and conversion impact should be measured regularly. This plan turns whitepapers and reports from downloadable documents into source assets that support sustainable AI Search visibility.

Let us make your brand visible in AI search.
Share your goals, we'll come back with a custom growth plan within one business day. A strategy lead will reach out personally.
Get in touch