Digital Data Analyst and Looker Dashboard (Data Studio) Services

Digital Data Analyst and Looker Dashboard are among the technologies that have reached the pinnacle of data management and analysis today. These technologies are critical for improving business performance, optimizing conversions and making more informed decisions.

What is a Digital Data Analyst?

A Digital Data Analyst is an expert who analyzes data collected on digital platforms and helps businesses achieve their goals by making sense of this data. They provide strategic advice to businesses by digging deep into different data sets such as web traffic, user behavior, sales data, etc.

In the digital world, making data-driven decisions is vital for businesses. Therefore, the role of digital data analysts is critical in shaping business strategies and driving optimization processes.

What is

What is Looker Dashboard?

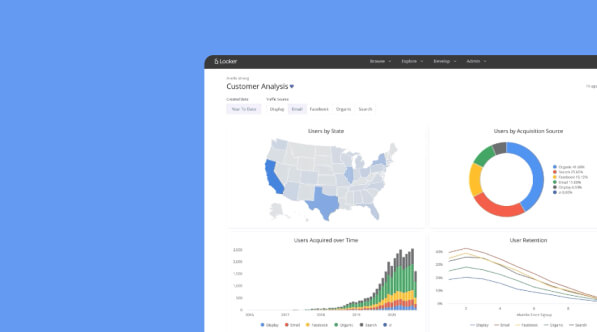
Looker Dashboard is a powerful data analytics platform that allows businesses to analyze and visualize large data sets. Looker accesses data using a proprietary query language called "LookML", which allows users to perform in-depth analysis and customized reporting.

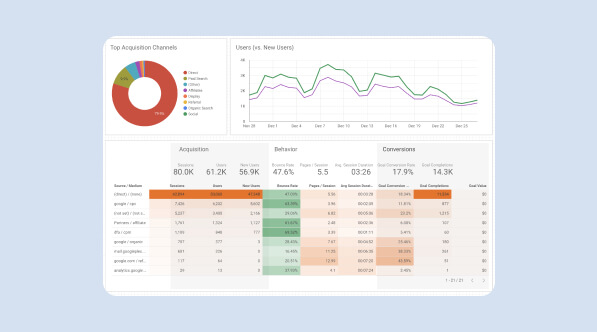
Looker's user-friendly interface allows even non-technical users to easily perform data analysis. It also helps businesses monitor and analyze data in real time with dynamic and interactive dashboards.


webtures

Looker Dashboard

What is the Importance of Looker Dashboard?

The in-depth analysis brought by Looker Dashboard offers many advantages for businesses. The most important of these advantages is the ability to make data-driven decisions.

Real Time Data Analysis

Today, businesses need to react quickly to instantly changing market conditions. Looker Dashboard informs businesses instantly through real-time data analysis. This provides the capacity to respond quickly to competitor movements, market changes or instant changes in consumer behavior.

Customized Reporting

Every business is unique and has specific needs. Dashboard Looker offers customized analyses for businesses with customized reporting features. In this way, businesses can analyze the most appropriate data sets in line with their own goals and strategies.

Monitoring Tracking and Conversion Rates

One of the most important components of an effective marketing strategy is to track and optimize conversion rates. Looker Studio Dashboard analyzes website visitors' behavior, purchase processes and conversion rates in detail. These analyses provide valuable insights to optimize marketing strategies.

  • Integration of Data Sources

    The first step to effective analysis is access to the right data sources. Looker Dashboard has the ability to combine data from different data sources. This creates a large pool of data, allowing for more comprehensive analysis.

  • Visualization and Charting

    Data becomes much more understandable through graphs and visualizations. With its user-friendly interface, Looker has the ability to transform even complex data sets into simple and effective visualizations. These visualizations enable quick insights to support business decisions.

  • LookML and Private Inquiry

    LookML is Looker's proprietary query language. It is much more flexible and powerful than standard SQL queries. With LookML, users can analyze data more deeply and create customized reports.

  • Tracking and Alarm Settings

    It is important to react quickly when anomalies or unexpected situations occur. Looker Dashboard has the ability to generate automatic notifications and alarms when certain conditions are met. This allows businesses to be informed instantly and act quickly when necessary.

webtures

Tools

Looker and Other Data Analysis Tools

There are many tools in the world of data analysis. Looker stands out from other popular tools with its features and unique advantages. However, in order to choose the right tool, you need to know the differences between it and other popular tools.

Comparison

Looker vs Tableau

Both Looker and Tableau are very popular for data visualization and business analytics. Looker is characterized by customizable features like LookML and deep API integrations. Tableau is known for its user-friendly interface and extensive visualization library. When choosing between the two platforms, it is important to focus on the specific needs of your business.

webtures
webtures

Integration

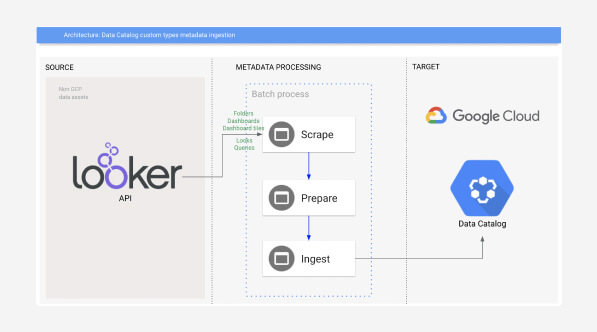
Looker's API Integrations

Google Looker Studio offers a large set of API integrations. This makes it possible to easily connect to different data sources and exchange data with third-party applications. These integrations are a huge advantage, especially for businesses working with dynamic and rapidly changing data sets.

Security

Security and Data Retention

Looker Studio is meticulous about data security. SSL encryption, multi-factor authentication and regular security audits ensure that data is kept safe. Furthermore, the data retention policies on the Looker platform can be customized according to the user's needs, thus meeting sensitive data retention requirements.

webtures

WEBTURES

ROI and Budget Analysis with Looker

For every business, ROI and budget tracking are critical. Looker's analytical tools help businesses manage these two areas more effectively.

yLmSYQ seo 1

WEBTURES

Calculating ROI

Looker automatically calculates ROI by combining various metrics and KPIs. This is invaluable for evaluating the performance of any investment, from marketing campaigns to IT investments.

Shhu2K sem 1

WEBTURES

Budget and Spending Tracking

Google Looker tackles budget planning with real-time spending tracking. Tracking monthly, quarterly or yearly expenses ensures effective budget management and prevents financial surprises.

Digital Data Analyst Trends with Looker's Role

As technology is constantly evolving, it is essential to keep up with the trends in data analytics. Looker's features allow you to work in harmony with these trends.

Features

Automation and Data Flow

Automation is becoming increasingly prominent in data analytics. Looker accelerates business processes with automation features such as automatic reporting and querying.

webtures
Webtures

Our Digital Data Analyst Services Using Looker Dashboard

Custom Looker Dashboard Design

In-Depth Data Analysis and Reporting

Customized LookML Interrogations

24/7 Technical Support

Let's Succeed Together!
Would you like to examine a sample working process?

By contacting us, you will be able to have preliminary information about our working process with a sample SEO planning process that will be defined to your e-mail address.

Annual Planning
Customised Process
Teamwork
and others...
Contact Us

Frequently Asked Questions about Digital Data Analyst and Looker

Looker is known for its flexibility and customizability. It is distinguished from standard data analysis tools by its unique features, especially LookML.

Virtually every industry can benefit from Looker's in-depth analytics capabilities. Marketing, finance, healthcare and e-commerce are some of the sectors that make extensive use of the platform's capabilities.

Looker offers different licensing options. Cost calculations can be made with customized plans according to the needs. For detailed information, you can visit Looker's official website.

Data analysis plays a huge role in a business' decision-making processes. With the right analysis methods, businesses can identify potential opportunities, mitigate risks and make more informed strategic decisions. Here are the steps to follow to be successful in data analysis:

  • Choosing the Right Data Sources: The accuracy of the analysis depends on the quality of the data used. Therefore, it is essential to use data from reliable and accurate data sources.
  • Data Cleaning: The data sets used may contain inconsistencies, missing data or errors. Data cleaning involves identifying and correcting such issues.
  • Using the Right Tools: Professional data analysis tools such as Looker, Tableau, etc. make it possible to carry out analysis processes in a simple and effective way.
  • Set Goals: The purpose and objectives of the analysis should be set from the beginning. This provides guidance on what data should be collected, what analysis methods to use, etc.
  • Visualization: Visualizing data makes the results of analysis more understandable. Tools such as Looker create dynamic visualizations, allowing data to be presented more effectively.
  • Evaluating Results: Matching analysis results to business strategies maximizes the business value of the analysis.

In addition to these steps, it is also important to continuously learn and follow industry trends to be successful in data analysis. Analysis methods and technologies are constantly evolving, so analysts need to keep abreast of these developments.

loader